
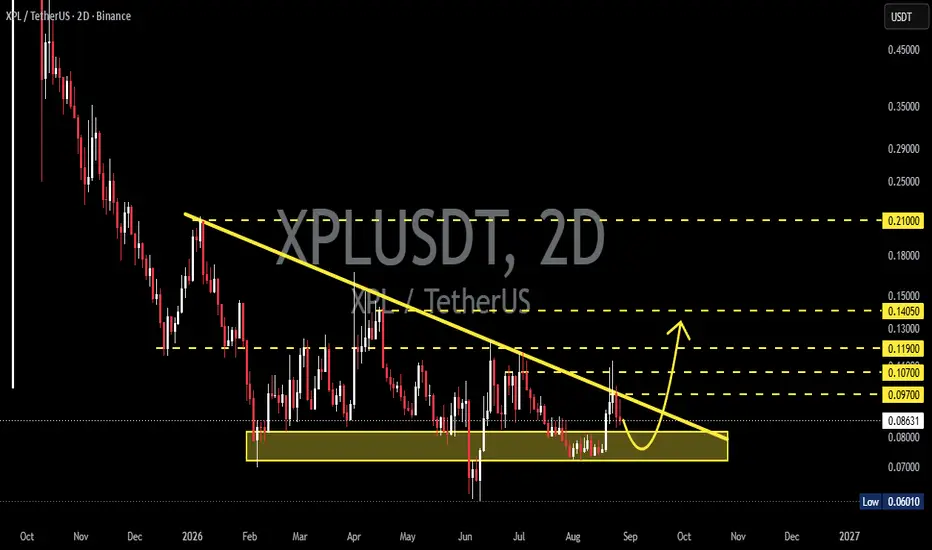
📊⚡ Technical Analysis — XPL/USDT
💵 Coin: XPL
⌛ Time Frame: 2D
📐 Structure: Descending Triangle / Descending Resistance Structure
🎯 Major Support: $0.072 – $0.082 🟨
📍 Current Price Area: ~$0.086
🔻 Major Trendline Resistance: Around $0.095–$0.100 and gradually declining over time
---
🔻📐 1. Descending Trendline — Major Resistance
The descending yellow trendline represents the main dynamic resistance 📉🔻 on the chart.
Since the rejection from around $0.21, XPL has continued forming a lower-high structure 📉, with major recovery attempts repeatedly being capped by this trendline.
📉 As long as price has not successfully broken out 🚀 and closed strongly above the trendline, the bearish/neutral structure remains valid.
However, the more frequently price tests the resistance without creating a significant new low, the greater the possibility of a breakout ⚡🚀 if buyers eventually take control of momentum.
---
🟨🛡️ 2. Major Demand Zone — $0.072–$0.082
This is the MOST IMPORTANT 🔥 area on the chart.
🟨 Demand / Support Zone: $0.072 – $0.082
Price has entered this area multiple times and received a bullish response 🟢📈.
During August, XPL once again defended the area around $0.074–$0.080, before rebounding toward $0.09–$0.10.
💡 As long as $0.072–$0.082 🟨 continues to hold, the structure still has the potential to develop into a bullish reversal 🚀📈.
---
🟢🚀 BULLISH SCENARIO
🚀📈 Breakout Above the Descending Trendline
The bullish scenario becomes significantly more interesting if XPL manages to:
1️⃣ 🚀 Break out of the descending trendline
⬇️
2️⃣ 🕯️ Close a 2D candle above the resistance
⬇️
3️⃣ 🔄 Retest the trendline and successfully hold it as support
⬇️
4️⃣ 📈 Continue forming higher highs
If the breakout is confirmed, the next horizontal resistance areas become potential targets:
🎯 $0.097 — First Resistance
🎯 $0.107 — Second Resistance
🎯 $0.119 — Major Resistance
🎯 $0.1405 — Major Breakout Target
🎯 $0.2100 — Major Historical Resistance
📌 These levels correspond to the horizontal resistance levels marked on the chart.
📈 $0.097–$0.107 will be the first important area to determine whether the breakout has sufficient momentum.
🔥 If XPL successfully breaks above $0.119, the bullish structure will become significantly stronger, potentially opening the way toward $0.1405.
🚀 Meanwhile, reclaiming $0.1405 would represent a much more significant structural change, as price would begin entering a major previous resistance area.
---
🔴⚠️ BEARISH SCENARIO
⚠️📉 Rejection from the Descending Trendline
The bearish scenario remains valid if price gets rejected again by the descending trendline.
If XPL fails to break resistance and moves lower again:
🔻 $0.097 → rejection
🔻 $0.086 → loss of rebound momentum
🔻 $0.082 → loss of the upper part of the demand zone
The most critical level is:
🚨🔻 $0.072
If a breakdown 📉 occurs with a 2D close below $0.072, the $0.072–$0.082 🟨 demand zone would be considered invalidated.
This could open the possibility of a retest toward:
🔻 $0.0601 — previous major low visible on the chart.
🚨 A breakdown below $0.0601 would make the bearish structure significantly more aggressive and could potentially lead to the search for a new support area below this level.
---
📐🔻 PATTERN — DESCENDING TRIANGLE
The structure on the chart strongly resembles a Descending Triangle 🔻📐, characterized by:
🔻 Lower highs forming beneath the descending trendline.
🟨 Horizontal support located around $0.072–$0.082.
🔄 Price becoming increasingly compressed ⚡ between declining resistance and support.
💥 This type of compression can eventually produce a strong expansion move 🚀📉 once either side is decisively broken.
🔥 What makes the current setup interesting is that price is currently above the demand zone 🟨 but still below the descending resistance 🔻.
🎯 This means XPL is currently approaching a DECISION POINT ⚖️🔥.
---
🧠📊 KEY LEVELS TO WATCH
Level Function
🟢🛡️ $0.072–$0.082 Major Demand / Support
⚪📍 ~$0.086 Current Price Area
🔴📐 ~$0.097–$0.100 Descending Trendline / Initial Resistance
🔴🎯 $0.107 Resistance
🔴🚧 $0.119 Major Resistance
🟠🔥 $0.1405 Major Resistance / Breakout Level
🟡🚀 $0.2100 Major Historical Resistance
🚨🔻 $0.0601 Major Low / Bearish Breakdown Reference
---
⚖️🔥 CONCLUSION
📊 XPL is currently in a compression phase ⚡ between the descending trendline 🔻 and the major demand zone 🟨.
🟢🚀 Bullish:
If XPL manages to break out of the descending trendline 📈 and successfully completes a 2D close + successful retest 🔄, the potential recovery toward:
🎯 $0.097 → $0.107 → $0.119 → $0.1405
becomes increasingly likely.
🔴📉 Bearish:
If price continues to be rejected by the trendline and eventually breaks down below $0.072 🚨, the descending triangle structure could develop into a bearish continuation 📉, with the next major area of interest around:
🎯 $0.0601
---
🎯🔥 MOST IMPORTANT LEVELS
🟨 $0.072–$0.082 = Major Support / Demand Zone
🔻 ~$0.097–$0.100 = Major Breakout Resistance
⚖️ As long as price remains between these two areas, XPL is still in a compression phase and the next direction has not been fully confirmed.
🚀 Breakout + 2D Close + Retest = Bullish Confirmation
🚨 Breakdown + 2D Close Below $0.072 = Bearish Confirmation
> ⚠️ As long as price remains between these two areas, XPL is still in a compression phase and the next direction has not been fully confirmed. A breakout or breakdown confirmed by a 2D candle close would provide a much stronger confirmation of the next major move.
#XPL #Plasma #XPLUSDT #Crypto #CryptoAnalysis #TechnicalAnalysis #Altcoins #AltcoinAnalysis #CryptoTrading #PriceAction #Breakout
💵 Coin:
XPL⌛ Time Frame: 2D
📐 Structure: Descending Triangle / Descending Resistance Structure
🎯 Major Support: $0.072 – $0.082 🟨
📍 Current Price Area: ~$0.086
🔻 Major Trendline Resistance: Around $0.095–$0.100 and gradually declining over time
---
🔻📐 1. Descending Trendline — Major Resistance
The descending yellow trendline represents the main dynamic resistance 📉🔻 on the chart.
Since the rejection from around $0.21, XPL has continued forming a lower-high structure 📉, with major recovery attempts repeatedly being capped by this trendline.
📉 As long as price has not successfully broken out 🚀 and closed strongly above the trendline, the bearish/neutral structure remains valid.
However, the more frequently price tests the resistance without creating a significant new low, the greater the possibility of a breakout ⚡🚀 if buyers eventually take control of momentum.
---
🟨🛡️ 2. Major Demand Zone — $0.072–$0.082
This is the MOST IMPORTANT 🔥 area on the chart.
🟨 Demand / Support Zone: $0.072 – $0.082
Price has entered this area multiple times and received a bullish response 🟢📈.
During August, XPL once again defended the area around $0.074–$0.080, before rebounding toward $0.09–$0.10.
💡 As long as $0.072–$0.082 🟨 continues to hold, the structure still has the potential to develop into a bullish reversal 🚀📈.
---
🟢🚀 BULLISH SCENARIO
🚀📈 Breakout Above the Descending Trendline
The bullish scenario becomes significantly more interesting if XPL manages to:
1️⃣ 🚀 Break out of the descending trendline
⬇️
2️⃣ 🕯️ Close a 2D candle above the resistance
⬇️
3️⃣ 🔄 Retest the trendline and successfully hold it as support
⬇️
4️⃣ 📈 Continue forming higher highs
If the breakout is confirmed, the next horizontal resistance areas become potential targets:
🎯 $0.097 — First Resistance
🎯 $0.107 — Second Resistance
🎯 $0.119 — Major Resistance
🎯 $0.1405 — Major Breakout Target
🎯 $0.2100 — Major Historical Resistance
📌 These levels correspond to the horizontal resistance levels marked on the chart.
📈 $0.097–$0.107 will be the first important area to determine whether the breakout has sufficient momentum.
🔥 If XPL successfully breaks above $0.119, the bullish structure will become significantly stronger, potentially opening the way toward $0.1405.
🚀 Meanwhile, reclaiming $0.1405 would represent a much more significant structural change, as price would begin entering a major previous resistance area.
---
🔴⚠️ BEARISH SCENARIO
⚠️📉 Rejection from the Descending Trendline
The bearish scenario remains valid if price gets rejected again by the descending trendline.
If XPL fails to break resistance and moves lower again:
🔻 $0.097 → rejection
🔻 $0.086 → loss of rebound momentum
🔻 $0.082 → loss of the upper part of the demand zone
The most critical level is:
🚨🔻 $0.072
If a breakdown 📉 occurs with a 2D close below $0.072, the $0.072–$0.082 🟨 demand zone would be considered invalidated.
This could open the possibility of a retest toward:
🔻 $0.0601 — previous major low visible on the chart.
🚨 A breakdown below $0.0601 would make the bearish structure significantly more aggressive and could potentially lead to the search for a new support area below this level.
---
📐🔻 PATTERN — DESCENDING TRIANGLE
The structure on the chart strongly resembles a Descending Triangle 🔻📐, characterized by:
🔻 Lower highs forming beneath the descending trendline.
🟨 Horizontal support located around $0.072–$0.082.
🔄 Price becoming increasingly compressed ⚡ between declining resistance and support.
💥 This type of compression can eventually produce a strong expansion move 🚀📉 once either side is decisively broken.
🔥 What makes the current setup interesting is that price is currently above the demand zone 🟨 but still below the descending resistance 🔻.
🎯 This means XPL is currently approaching a DECISION POINT ⚖️🔥.
---
🧠📊 KEY LEVELS TO WATCH
Level Function
🟢🛡️ $0.072–$0.082 Major Demand / Support
⚪📍 ~$0.086 Current Price Area
🔴📐 ~$0.097–$0.100 Descending Trendline / Initial Resistance
🔴🎯 $0.107 Resistance
🔴🚧 $0.119 Major Resistance
🟠🔥 $0.1405 Major Resistance / Breakout Level
🟡🚀 $0.2100 Major Historical Resistance
🚨🔻 $0.0601 Major Low / Bearish Breakdown Reference
---
⚖️🔥 CONCLUSION
📊 XPL is currently in a compression phase ⚡ between the descending trendline 🔻 and the major demand zone 🟨.
🟢🚀 Bullish:
If XPL manages to break out of the descending trendline 📈 and successfully completes a 2D close + successful retest 🔄, the potential recovery toward:
🎯 $0.097 → $0.107 → $0.119 → $0.1405
becomes increasingly likely.
🔴📉 Bearish:
If price continues to be rejected by the trendline and eventually breaks down below $0.072 🚨, the descending triangle structure could develop into a bearish continuation 📉, with the next major area of interest around:
🎯 $0.0601
---
🎯🔥 MOST IMPORTANT LEVELS
🟨 $0.072–$0.082 = Major Support / Demand Zone
🔻 ~$0.097–$0.100 = Major Breakout Resistance
⚖️ As long as price remains between these two areas, XPL is still in a compression phase and the next direction has not been fully confirmed.
🚀 Breakout + 2D Close + Retest = Bullish Confirmation
🚨 Breakdown + 2D Close Below $0.072 = Bearish Confirmation
> ⚠️ As long as price remains between these two areas, XPL is still in a compression phase and the next direction has not been fully confirmed. A breakout or breakdown confirmed by a 2D candle close would provide a much stronger confirmation of the next major move.
#XPL #Plasma #XPLUSDT #Crypto #CryptoAnalysis #TechnicalAnalysis #Altcoins #AltcoinAnalysis #CryptoTrading #PriceAction #Breakout

✅ Get Free Signals! Join Our Telegram Channel Here: t.me/TheCryptoNuclear
✅ Twitter: twitter.com/crypto_nuclear
✅ Join Bybit : partner.bybit.com/b/nuclearvip
✅ Benefits : Lifetime Trading Fee Discount -50%
✅ Twitter: twitter.com/crypto_nuclear
✅ Join Bybit : partner.bybit.com/b/nuclearvip
✅ Benefits : Lifetime Trading Fee Discount -50%
Feragatname
Bilgiler ve yayınlar, TradingView tarafından sağlanan veya onaylanan finansal, yatırım, alım satım veya diğer türden tavsiye veya öneriler anlamına gelmez ve teşkil etmez. Kullanım Koşulları bölümünde daha fazlasını okuyun.
✅ Get Free Signals! Join Our Telegram Channel Here: t.me/TheCryptoNuclear
✅ Twitter: twitter.com/crypto_nuclear
✅ Join Bybit : partner.bybit.com/b/nuclearvip
✅ Benefits : Lifetime Trading Fee Discount -50%
✅ Twitter: twitter.com/crypto_nuclear
✅ Join Bybit : partner.bybit.com/b/nuclearvip
✅ Benefits : Lifetime Trading Fee Discount -50%
Feragatname
Bilgiler ve yayınlar, TradingView tarafından sağlanan veya onaylanan finansal, yatırım, alım satım veya diğer türden tavsiye veya öneriler anlamına gelmez ve teşkil etmez. Kullanım Koşulları bölümünde daha fazlasını okuyun.