
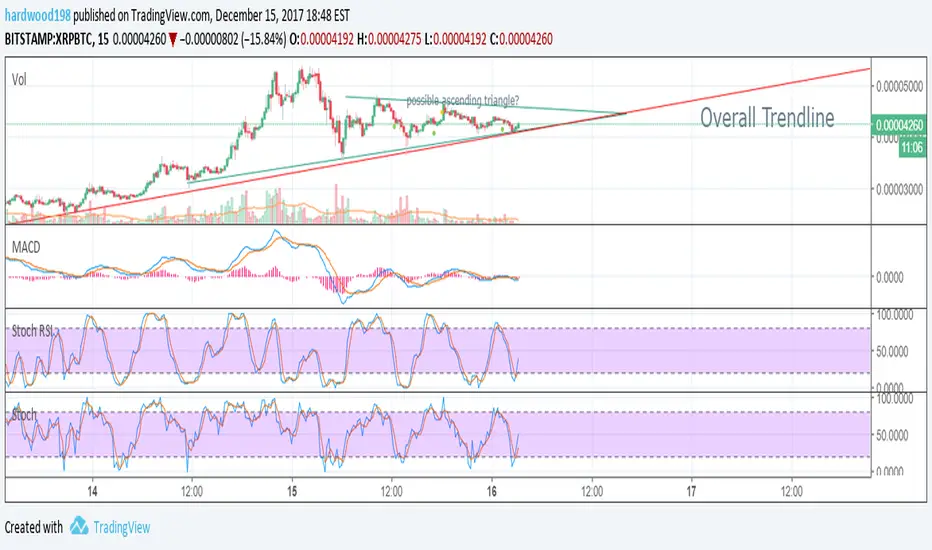
1. Overall trendline upwards -> Trend should continue
2. Possible ascending triangle -> Sign of bullish market and possible breakout soon
3. MACD, RSI, Stochastic indicators all in favour of upward trend
Enter the market using the green line, set stop loss below the red line. If price drops below red line, indicates possible trend reversal. Can be conservative and take profit once upper green line is reached.
Looks like ripple set to continue increasing, at least for the next day or so! Hopefully breakout occurs and price further increases.
GL with trading!
2. Possible ascending triangle -> Sign of bullish market and possible breakout soon
3. MACD, RSI, Stochastic indicators all in favour of upward trend
Enter the market using the green line, set stop loss below the red line. If price drops below red line, indicates possible trend reversal. Can be conservative and take profit once upper green line is reached.
Looks like ripple set to continue increasing, at least for the next day or so! Hopefully breakout occurs and price further increases.
GL with trading!

Feragatname
Bilgiler ve yayınlar, TradingView tarafından sağlanan veya onaylanan finansal, yatırım, alım satım veya diğer türden tavsiye veya öneriler anlamına gelmez ve teşkil etmez. Kullanım Koşulları bölümünde daha fazlasını okuyun.
Feragatname
Bilgiler ve yayınlar, TradingView tarafından sağlanan veya onaylanan finansal, yatırım, alım satım veya diğer türden tavsiye veya öneriler anlamına gelmez ve teşkil etmez. Kullanım Koşulları bölümünde daha fazlasını okuyun.