
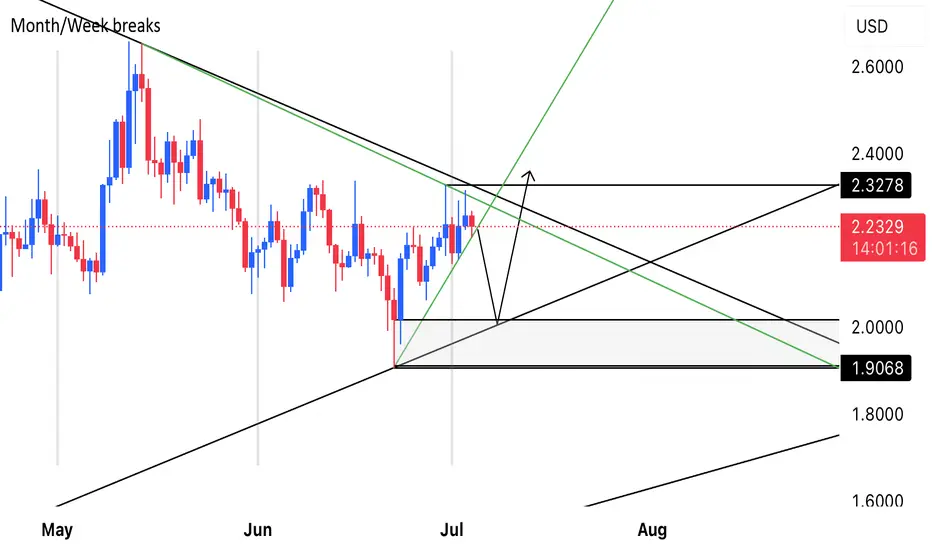
XRP DAILY CHART ANALYSIS 📈
🟩Green lines are “inside trendline” having last interactions with price.
Price did a third touch on the bearish inside trend line yesterday 3rd July @ 2.3157
And current interaction with the bullish “inside trendline” today.
Fundamentally, expect short term USD strength with positive US data as catalyst from yesterday’s release.
Market could extend to closest support @2.1714
If bullish “inside trendline” is broken, we expect support and outer trendline (Black) third touch @2.0181.
If there’s a strong bullish signal convicted to positive XRP or Crypto fundamentals, we expect a bullish move back to at least 2.4
Short term - Bearish 🟥
Medium to long term - Bullish 🟩
🟩Green lines are “inside trendline” having last interactions with price.
Price did a third touch on the bearish inside trend line yesterday 3rd July @ 2.3157
And current interaction with the bullish “inside trendline” today.
Fundamentally, expect short term USD strength with positive US data as catalyst from yesterday’s release.
Market could extend to closest support @2.1714
If bullish “inside trendline” is broken, we expect support and outer trendline (Black) third touch @2.0181.
If there’s a strong bullish signal convicted to positive XRP or Crypto fundamentals, we expect a bullish move back to at least 2.4
Short term - Bearish 🟥
Medium to long term - Bullish 🟩

İlgili yayınlar
Feragatname
Bilgiler ve yayınlar, TradingView tarafından sağlanan veya onaylanan finansal, yatırım, alım satım veya diğer türden tavsiye veya öneriler anlamına gelmez ve teşkil etmez. Kullanım Koşulları bölümünde daha fazlasını okuyun.
İlgili yayınlar
Feragatname
Bilgiler ve yayınlar, TradingView tarafından sağlanan veya onaylanan finansal, yatırım, alım satım veya diğer türden tavsiye veya öneriler anlamına gelmez ve teşkil etmez. Kullanım Koşulları bölümünde daha fazlasını okuyun.