
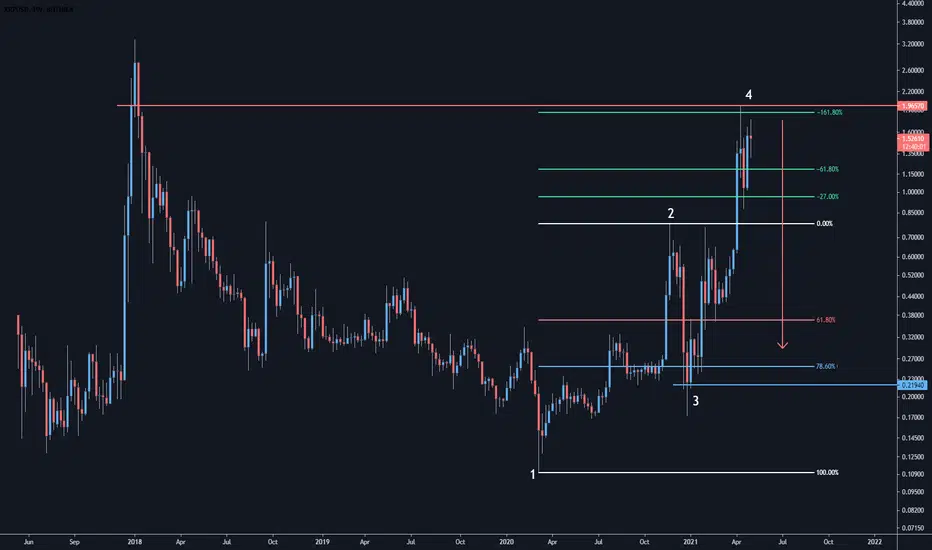
Following the previous post of the Monthly Timeframe, this Weekly Fibonacci further validates why $1.96 is a rejection zone.
The -161.8% Extension aligns with the Dec 2017 / Jan 2018 candle closes where we have tapped it perfectly.
I would anticipate that the next move would be back towards 61.8% and 78.6% retracements where we can identify the next set up.
I will post a Daily Timeframe analysis of this bias to complete the full top-down analysis which shows more confirmations.
The -161.8% Extension aligns with the Dec 2017 / Jan 2018 candle closes where we have tapped it perfectly.
I would anticipate that the next move would be back towards 61.8% and 78.6% retracements where we can identify the next set up.
I will post a Daily Timeframe analysis of this bias to complete the full top-down analysis which shows more confirmations.
Not
Monthly Analysis - 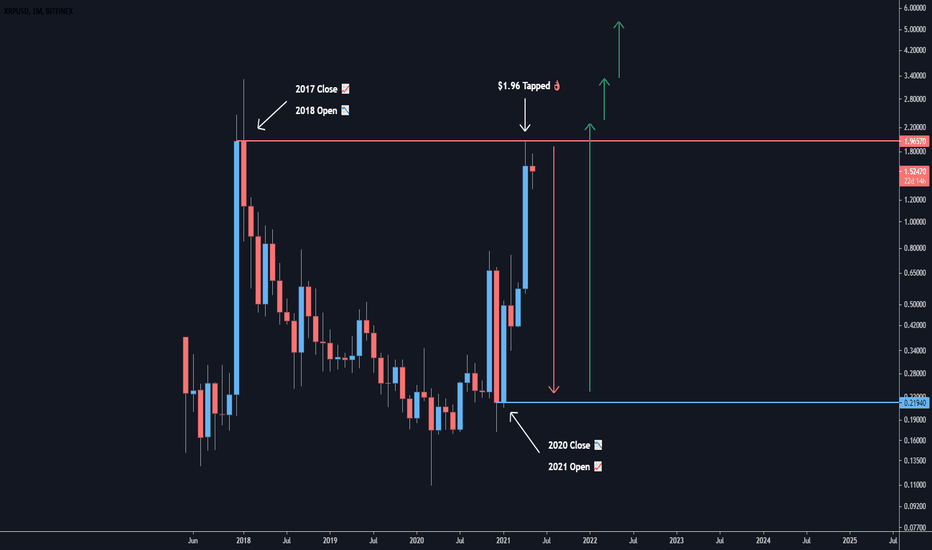
Not
Daily Analysis - 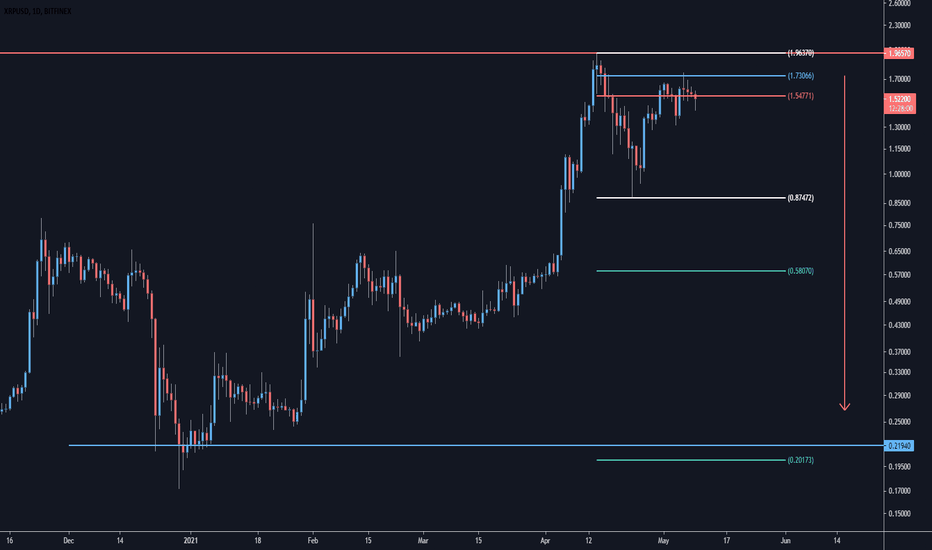

Feragatname
Bilgiler ve yayınlar, TradingView tarafından sağlanan veya onaylanan finansal, yatırım, alım satım veya diğer türden tavsiye veya öneriler anlamına gelmez ve teşkil etmez. Kullanım Koşulları bölümünde daha fazlasını okuyun.
Feragatname
Bilgiler ve yayınlar, TradingView tarafından sağlanan veya onaylanan finansal, yatırım, alım satım veya diğer türden tavsiye veya öneriler anlamına gelmez ve teşkil etmez. Kullanım Koşulları bölümünde daha fazlasını okuyun.