
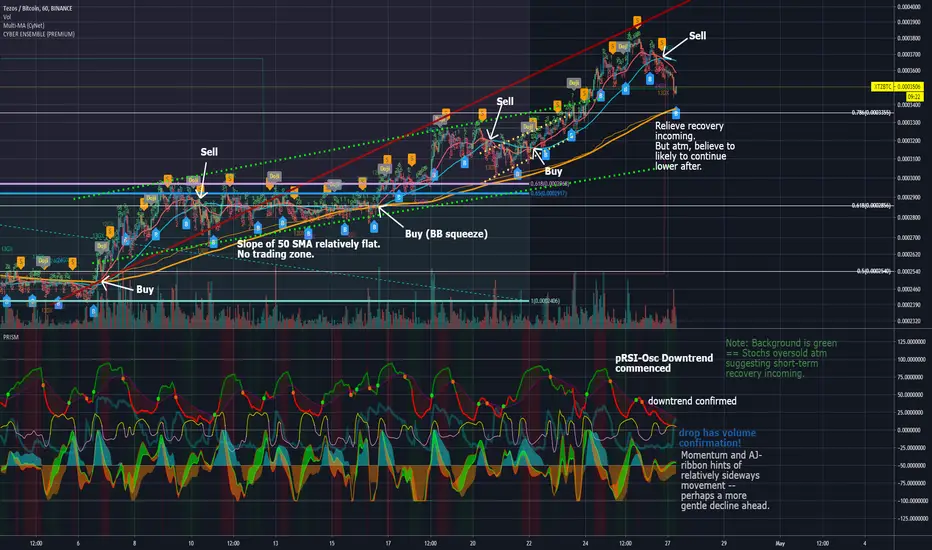
A couple of days up to 2 weeks max of downtrend expected to have commenced.
Probable target is perhaps at the thick orange 200 SMA around 78.6% Fib.
However if XTZ drops below the 200 SMA and gets rejected, then it suggests a more drawn out bearish phase.
Probable target is perhaps at the thick orange 200 SMA around 78.6% Fib.
However if XTZ drops below the 200 SMA and gets rejected, then it suggests a more drawn out bearish phase.
Not
Waiting for a re-entry point since 6hrly bullish trend still looking intact (unless a clear and significant negative slope is established on the 21 EMA on the 6hrly).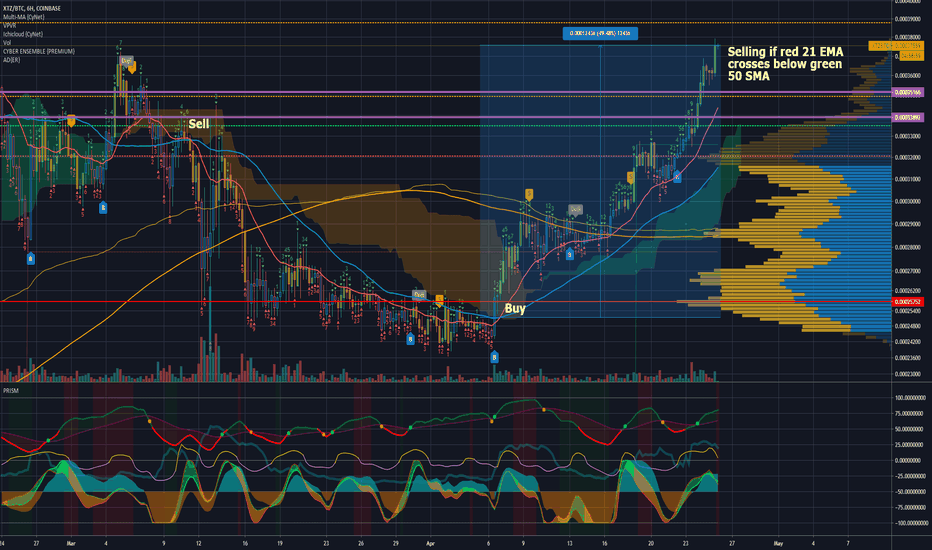
Not
Also here's a chart showing bearish divergence occurring on the pRSI (in the PRISM Oscillators Set). Now waiting for a bullish divergence to appear.Not
Not
Sold all my ENJ to BTC at the same time earlier btw, when the 21 EMA crosses below the 50 SMA.The crossing of the 21 EMA below the 200 SMA provides the nail on the coffin for these two altcoin in the short (and perhaps into the mid-term).
Not
The more significant 50/200 SMA DX (death cross) incoming.Not
Not
50/200 SMA Death Cross already happened.Both the relative slopes MA lines as well as the PRISM's main pRSI-osc indicating further downside to come.
Target is at the 61.8% Fib level @ about 0.0002969 BTC (conservative estimate) down to the 0.0002856 BTC level.
Will need to re-analyse the PRISM oscillators again when the time comes.
Not
Presently, some interaction with the 78.6% Fib level which is expected. However, general trend is still bearish, with the 21EMA and 50SMA appears to be in widening trajectories. The PRISM S-Osc does hint of a short term recovery.My prediction is that it will bounce up to the 21 EMA and get rejected.
And to note, regardless if the target is met, I am bullish once the 21 EMA crosses above the 50 SMA again, and the 50 SMA then subsequently establishes an increasing upward gradient/slope.
Not
Not
Not
AB=CD Measured move predicts target at bottom of broadening wedge @ 0.0003085 BTC Zoomed in view.
Not
Bitcoin Dominance about to enter a bullish phase on the daily chart!Not
Bullish/Bearish Views:Not
The faint blue Volume Oscillator in the PRISM oscillator is falling off as XTZ rebounded -- not promising for the bulls. STOCHs of the pRSI-osc is in the overbought territory presently. I see price continuing sideways, unable to break above the 50 SMA nor the upper side of the wedge, and then continues lower.Not
Bearish view invalidated! :)Not
XTZ now above the 50SMA and looks like a bullish cross is incoming.The 50SMA now is positively-sloping.
Not
The short-term bullish phase is about to be over, the pRSI-Osc on the PRISM Oscillator set is starting to curve down. Cyber Ensemble already signaled a sell on the 1 hrly.Not
21 EMA / 50 SMA death cross on the 3 hrly!Speculative AB=CD measured move target to buy in.
Not
Not
Same with my ENJBTC trade.Not
Sign of a turn around in the PRISM Oscillators. XTZ supported by the 200 SMA on the 3 hourly to consolidate. BTC broke above the 8750 USD VPVR resistance turned support level. If it holds, and consolidates sideways, that will catalyze yet another short term altcoin pump.
Feragatname
Bilgiler ve yayınlar, TradingView tarafından sağlanan veya onaylanan finansal, yatırım, alım satım veya diğer türden tavsiye veya öneriler anlamına gelmez ve teşkil etmez. Kullanım Koşulları bölümünde daha fazlasını okuyun.
Feragatname
Bilgiler ve yayınlar, TradingView tarafından sağlanan veya onaylanan finansal, yatırım, alım satım veya diğer türden tavsiye veya öneriler anlamına gelmez ve teşkil etmez. Kullanım Koşulları bölümünde daha fazlasını okuyun.