
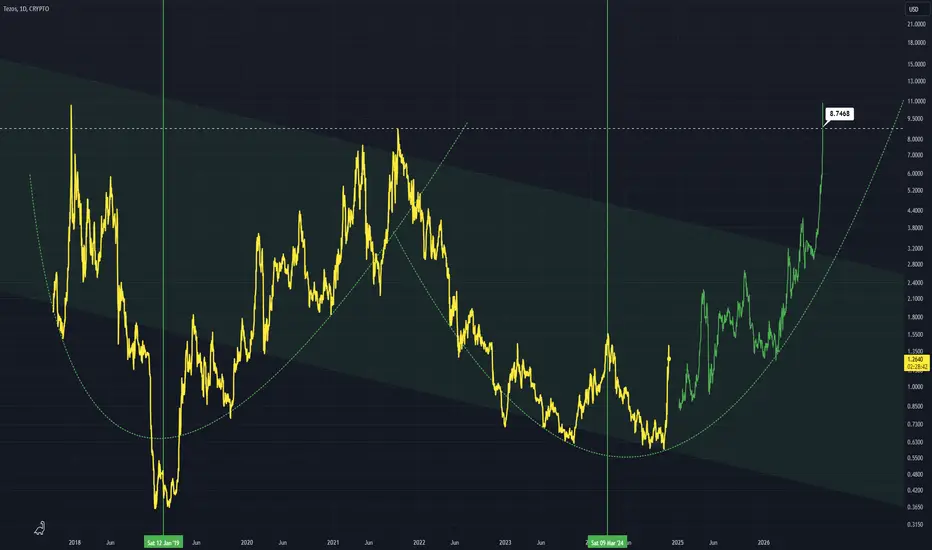
Although a large down channel can be plotted an overarching W pattern can be observed with highs at the dashed white line
Right now XTZ is moving from a bear market into a bull one
I see a pump up to about ~$8
The vertical lines show the point where the shift from bear to bull occurs
Daily chart
Right now XTZ is moving from a bear market into a bull one
I see a pump up to about ~$8
The vertical lines show the point where the shift from bear to bull occurs
Daily chart

Feragatname
Bilgiler ve yayınlar, TradingView tarafından sağlanan veya onaylanan finansal, yatırım, alım satım veya diğer türden tavsiye veya öneriler anlamına gelmez ve teşkil etmez. Kullanım Koşulları bölümünde daha fazlasını okuyun.
Feragatname
Bilgiler ve yayınlar, TradingView tarafından sağlanan veya onaylanan finansal, yatırım, alım satım veya diğer türden tavsiye veya öneriler anlamına gelmez ve teşkil etmez. Kullanım Koşulları bölümünde daha fazlasını okuyun.