
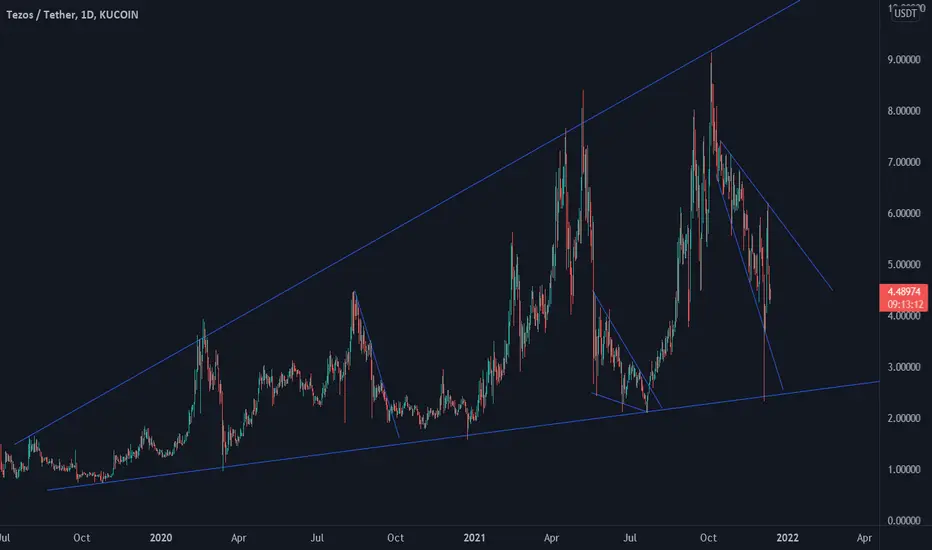
If zoom out, we can see that the Tezos is moving in an inverted wedge/triangle pattern. There are support and resistance lines/areas which when the price reaches, will bounce off it. Currently, XTZ is moving down, also in an inverted wedge/triangle. The best area to buy is when the price reaches the area near the bottom of the pattern.

Feragatname
Bilgiler ve yayınlar, TradingView tarafından sağlanan veya onaylanan finansal, yatırım, alım satım veya diğer türden tavsiye veya öneriler anlamına gelmez ve teşkil etmez. Kullanım Koşulları bölümünde daha fazlasını okuyun.
Feragatname
Bilgiler ve yayınlar, TradingView tarafından sağlanan veya onaylanan finansal, yatırım, alım satım veya diğer türden tavsiye veya öneriler anlamına gelmez ve teşkil etmez. Kullanım Koşulları bölümünde daha fazlasını okuyun.