
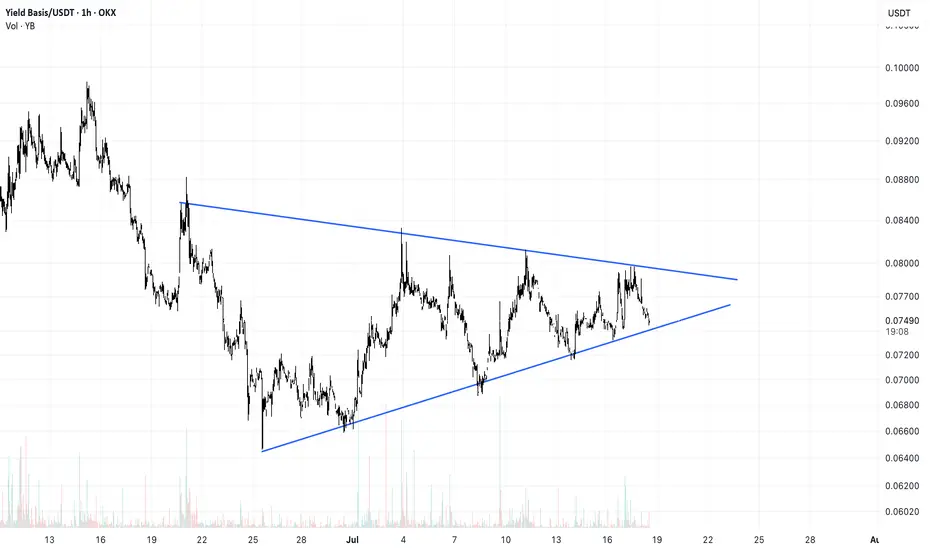
YB/USDT is consolidating inside a symmetrical triangle on the 1H chart. Price has pulled back toward the ascending support after another rejection from the upper trendline.
Holding the lower boundary could lead to another test of descending resistance. A confirmed breakout above the triangle would favor bullish continuation, while a breakdown below support would weaken the structure and open the way for further downside.
Holding the lower boundary could lead to another test of descending resistance. A confirmed breakout above the triangle would favor bullish continuation, while a breakdown below support would weaken the structure and open the way for further downside.

Feragatname
Bilgiler ve yayınlar, TradingView tarafından sağlanan veya onaylanan finansal, yatırım, alım satım veya diğer türden tavsiye veya öneriler anlamına gelmez ve teşkil etmez. Kullanım Koşulları bölümünde daha fazlasını okuyun.
Feragatname
Bilgiler ve yayınlar, TradingView tarafından sağlanan veya onaylanan finansal, yatırım, alım satım veya diğer türden tavsiye veya öneriler anlamına gelmez ve teşkil etmez. Kullanım Koşulları bölümünde daha fazlasını okuyun.