YFIBTC - Case for Bulls
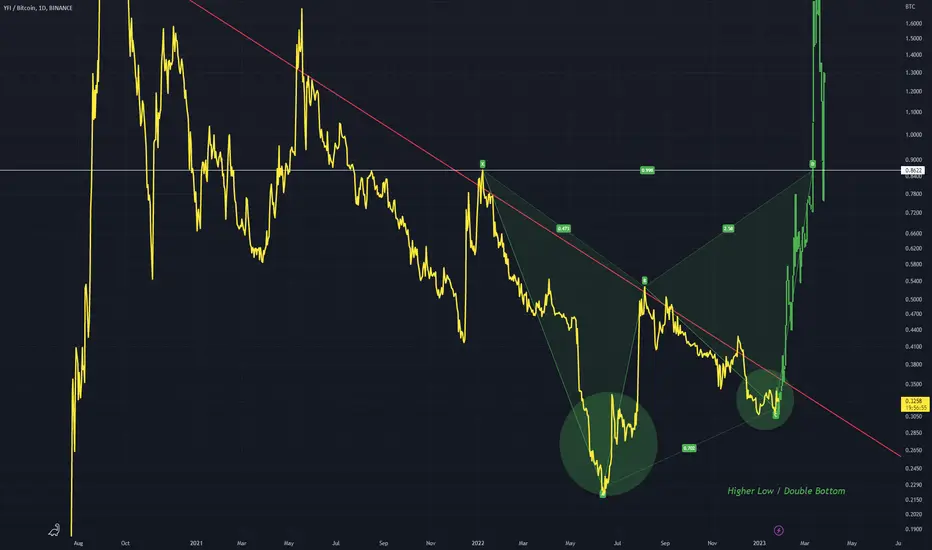
Currently this red trendline is dominant and should be considered when looking at this chart, as the dominant trend is down.
Ill give it a shot at picking the bottom though. A higher low and subsequent double bottom is a good candidate for a potential reversal
The ABCD pattern shows my thought process when looking at this chart structure
If price breaks down when the red line is hit then the bears are in control, but if it does breakout I expect it to move to D
Ill give it a shot at picking the bottom though. A higher low and subsequent double bottom is a good candidate for a potential reversal
The ABCD pattern shows my thought process when looking at this chart structure
If price breaks down when the red line is hit then the bears are in control, but if it does breakout I expect it to move to D

Feragatname
Bilgiler ve yayınlar, TradingView tarafından sağlanan veya onaylanan finansal, yatırım, alım satım veya diğer türden tavsiye veya öneriler anlamına gelmez ve teşkil etmez. Kullanım Koşulları bölümünde daha fazlasını okuyun.
Feragatname
Bilgiler ve yayınlar, TradingView tarafından sağlanan veya onaylanan finansal, yatırım, alım satım veya diğer türden tavsiye veya öneriler anlamına gelmez ve teşkil etmez. Kullanım Koşulları bölümünde daha fazlasını okuyun.