Güncellendi
ZClassic
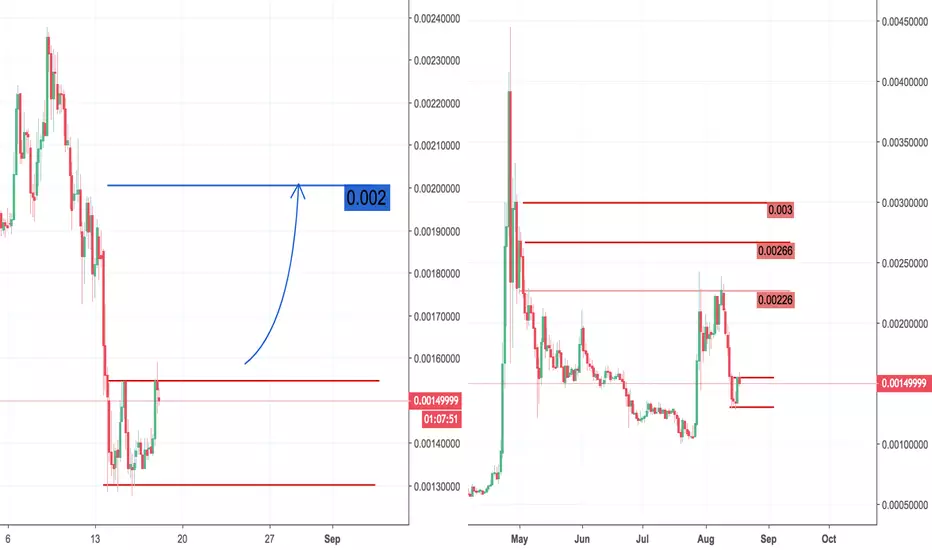
The left chart shows the trading range we are currently in. A break up would result in testing the 0.002 as a short term projection.
The right chart indicates more a long term projection. The resistance lines are shown.
Big news will follow up, until the fork happening on 10th of September.
The ANON Team will be announcing exchange markets , and some new surprises, which in my opinion will lead to the highs. Let's see :)
The right chart indicates more a long term projection. The resistance lines are shown.
Big news will follow up, until the fork happening on 10th of September.
The ANON Team will be announcing exchange markets , and some new surprises, which in my opinion will lead to the highs. Let's see :)
Not

Feragatname
Bilgiler ve yayınlar, TradingView tarafından sağlanan veya onaylanan finansal, yatırım, alım satım veya diğer türden tavsiye veya öneriler anlamına gelmez ve teşkil etmez. Kullanım Koşulları bölümünde daha fazlasını okuyun.
Feragatname
Bilgiler ve yayınlar, TradingView tarafından sağlanan veya onaylanan finansal, yatırım, alım satım veya diğer türden tavsiye veya öneriler anlamına gelmez ve teşkil etmez. Kullanım Koşulları bölümünde daha fazlasını okuyun.