
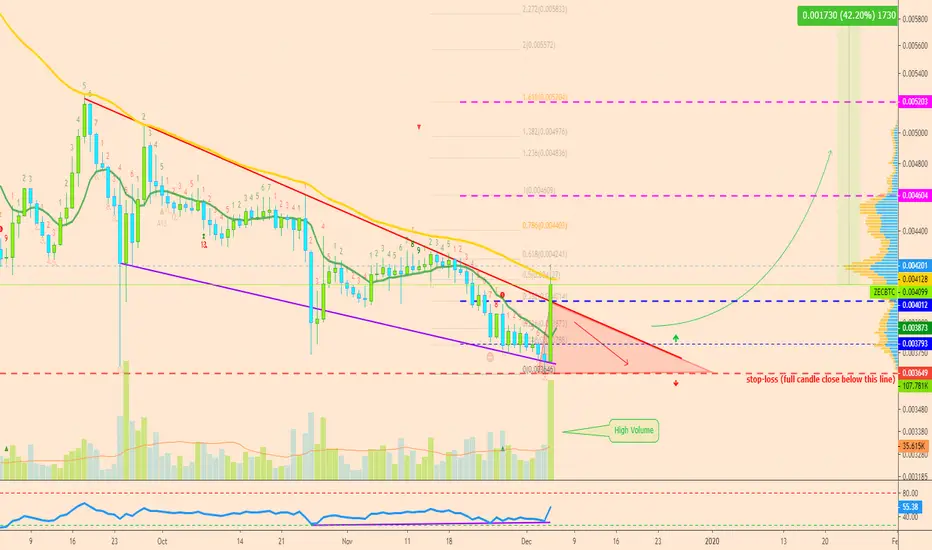
The Zcash (ZECBTC) chart is now printing a very strong bullish candlestick to break above EMA10.
We are seeing good volume coming in after a new low was hit yesterday.
I can see that bullish divergence is showing with the RSI and yesterday's candlestick was a Doji.
Additional details, including targets, can be found on the chart.
Feel free to hit LIKE to show your support.
Thanks a lot for reading.
Namaste.
We are seeing good volume coming in after a new low was hit yesterday.
I can see that bullish divergence is showing with the RSI and yesterday's candlestick was a Doji.
Additional details, including targets, can be found on the chart.
Feel free to hit LIKE to show your support.
Thanks a lot for reading.
Namaste.
Not
New chart for Zcash (ZECBTC)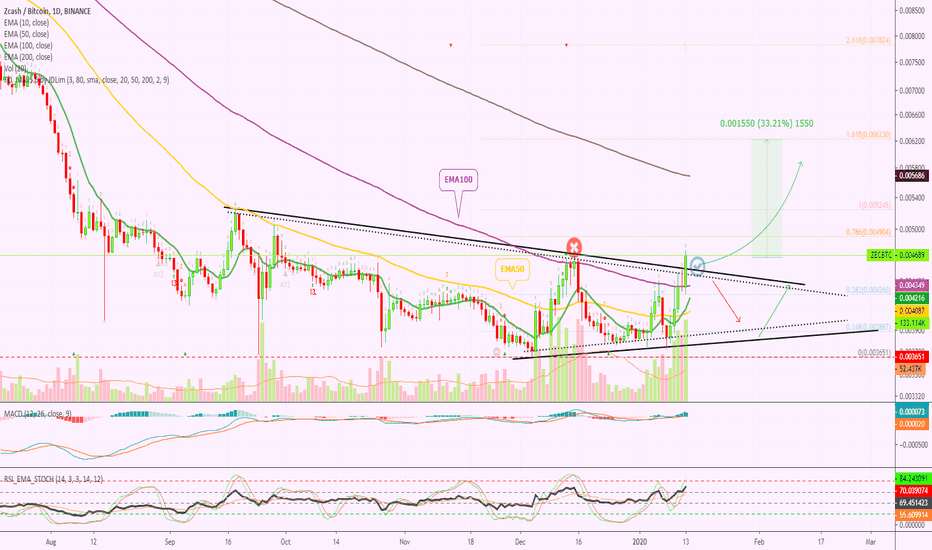

Trading Cryptocurrencies can be the hardest undertaking ever without the right trade-numbers, without accurate private-access information. Free is free, but the best always requires sweat, an investment. Since 2017 👇
t.me/masteranandatrades/8778
t.me/masteranandatrades/8778
İlgili yayınlar
Feragatname
Bilgiler ve yayınlar, TradingView tarafından sağlanan veya onaylanan finansal, yatırım, alım satım veya diğer türden tavsiye veya öneriler anlamına gelmez ve teşkil etmez. Kullanım Koşulları bölümünde daha fazlasını okuyun.
Trading Cryptocurrencies can be the hardest undertaking ever without the right trade-numbers, without accurate private-access information. Free is free, but the best always requires sweat, an investment. Since 2017 👇
t.me/masteranandatrades/8778
t.me/masteranandatrades/8778
İlgili yayınlar
Feragatname
Bilgiler ve yayınlar, TradingView tarafından sağlanan veya onaylanan finansal, yatırım, alım satım veya diğer türden tavsiye veya öneriler anlamına gelmez ve teşkil etmez. Kullanım Koşulları bölümünde daha fazlasını okuyun.