
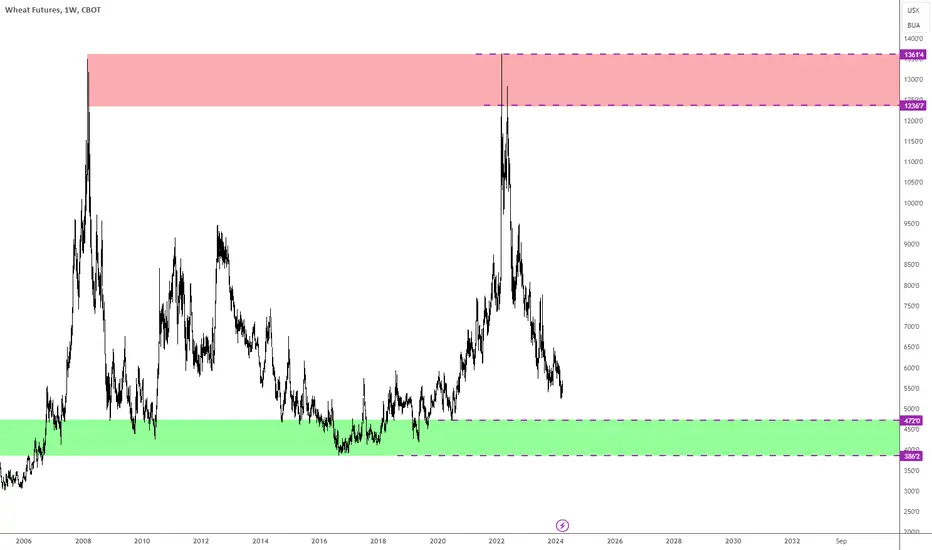
Supply and demand zones for Wheat on the weekly chart.
Once you enter the zone, look for the lower timeframe reversal patterns, extended waves, classic trendline breaks, etc.
Drop down to the Daily for refined supply and demand zones.
Drop down to 1 hour chart for the current trend after you see the reversal pattern.
Once you enter the zone, look for the lower timeframe reversal patterns, extended waves, classic trendline breaks, etc.
Drop down to the Daily for refined supply and demand zones.
Drop down to 1 hour chart for the current trend after you see the reversal pattern.

Chris Juliano
Feragatname
Bilgiler ve yayınlar, TradingView tarafından sağlanan veya onaylanan finansal, yatırım, alım satım veya diğer türden tavsiye veya öneriler anlamına gelmez ve teşkil etmez. Kullanım Koşulları bölümünde daha fazlasını okuyun.
Chris Juliano
Feragatname
Bilgiler ve yayınlar, TradingView tarafından sağlanan veya onaylanan finansal, yatırım, alım satım veya diğer türden tavsiye veya öneriler anlamına gelmez ve teşkil etmez. Kullanım Koşulları bölümünde daha fazlasını okuyun.