
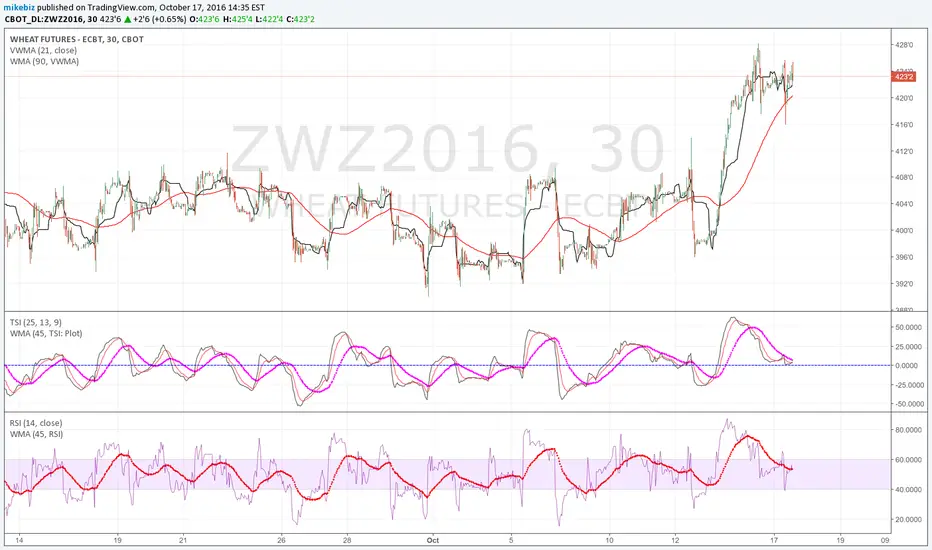
Looking at 30M chart, it's possible that wheat has made its pullback. The TSI could be finding support at 0 and RSI on 40. Based on next open and if these indicators move up off this support may try a dec wheat call.
Looking at the daily chart, the RSI and TSI look bullish and the ADX with +DMI looks like it could be setting up a change in dominance from down trend.

Daily looks like it hit some resistance at the 23.6% retrace area between the 6/8 high and 8/31 low. I think that price will move up to challenge other areas of retrace as noted on daily chart.
Looking at the daily chart, the RSI and TSI look bullish and the ADX with +DMI looks like it could be setting up a change in dominance from down trend.
Daily looks like it hit some resistance at the 23.6% retrace area between the 6/8 high and 8/31 low. I think that price will move up to challenge other areas of retrace as noted on daily chart.

İlgili yayınlar
Feragatname
Bilgiler ve yayınlar, TradingView tarafından sağlanan veya onaylanan finansal, yatırım, alım satım veya diğer türden tavsiye veya öneriler anlamına gelmez ve teşkil etmez. Kullanım Koşulları bölümünde daha fazlasını okuyun.
İlgili yayınlar
Feragatname
Bilgiler ve yayınlar, TradingView tarafından sağlanan veya onaylanan finansal, yatırım, alım satım veya diğer türden tavsiye veya öneriler anlamına gelmez ve teşkil etmez. Kullanım Koşulları bölümünde daha fazlasını okuyun.