GOLD - A pullback before an upward move FX:XAUUSD is forming a long squeeze at a key support zone and recovering from yesterday’s decline. The rise from the local low amounted to 2.5%. Before the rally continues, a pullback to 4738 is possible as traders seek liquidity.
Trump unilaterally extended the ceasefire, giving the dollar a temporary respite and supporting gold. However, negotiations have stalled; Iran is waiting for a “comprehensive proposal” from the U.S., and the port blockades remain in place.
Threats of escalation (gold reacts negatively to such developments)
Fed: Kevin Warsh signaled during testimony that he may be less “dovish” than previously expected.
De-escalation, the success of London talks on reopening the Strait, and dollar weakness could support further gold gains. However, a breakdown in negotiations, escalation, a strengthening dollar, and expectations of a Fed rate hike will increase pressure on the metal...
Resistance levels: 4772, 4798, 4830
Support levels: 4738, 4700, 4668
Before rising, gold may test the liquidity zone of 4738–4720. However, a breakout and consolidation above 4770 could trigger a premature rally.
It is also worth monitoring statements from countries involved in the Middle East conflict; the market may react unpredictably to any sharp statements.
Best regards, R. Linda!  Long
Long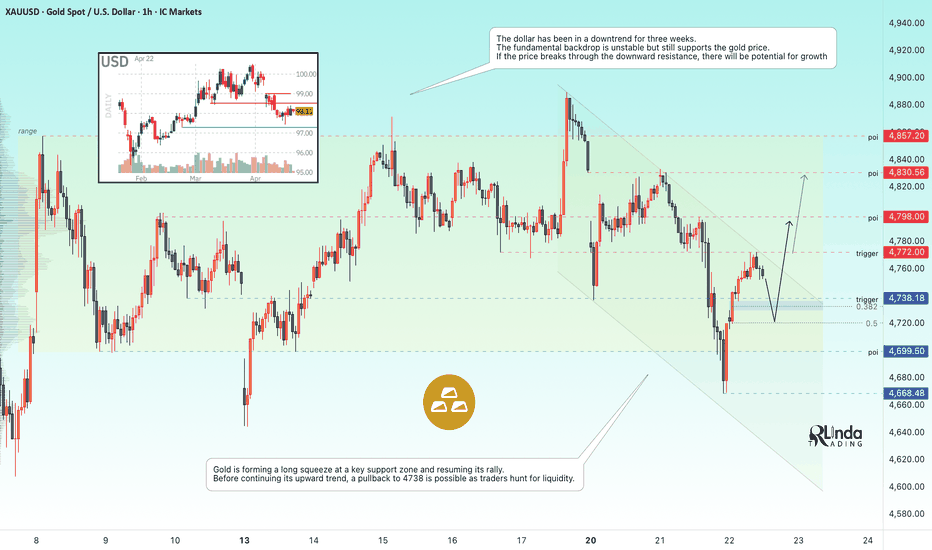
BITCOIN - The bulls may prove themselves...BINANCE:BTCUSDT.P is showing signs of a bullish trend on a local scale. The asset has been forming a bullish trend since April. Focus on the key resistance level of 76,000
Bitcoin is forming a medium-term uptrend that began in early April. The price will continue to test the resistance zone of 76,000–76,300
A local bullish structure is forming, within which Bitcoin is attempting to break through the 76K resistance level. If the bulls maintain control of this area, we will see potential for growth toward 78K–80K
Resistance levels: 76,000, 76,300, 78,000
Support levels: 74,560, 73,700
A shallow pullback followed by another breakout attempt is a fairly strong bullish signal. Confirmation of the breakout will be local consolidation above the key resistance zone, which could trigger further growth toward 78K–80K.
Best Regards, R. Linda!  Long
Long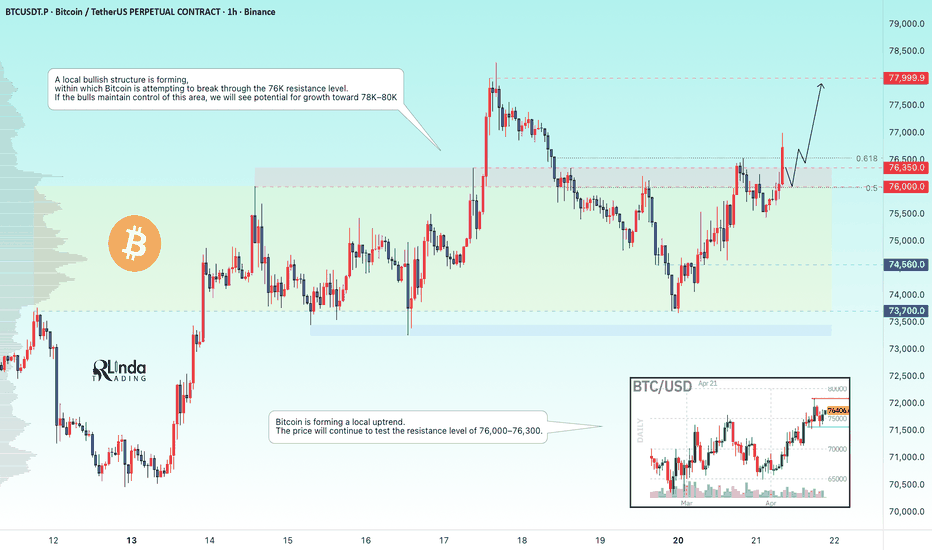
GOLD - The market didn't trust Friday's positive newsICMARKETS:XAUUSD reacted positively to the de-escalation of the conflict in the Middle East on Friday; however, a couple of hours later, the market lost faith in the news and resumed selling...
Iran closed the Strait of Hormuz in response to the breakdown of the ceasefire in Lebanon. The geopolitical backdrop is deteriorating. The market may react aggressively to any escalation: the dollar and oil up, gold down.
Direct peace talks with the U.S. have been suspended until Washington changes its “maximalist” demands, according to Iran’s Foreign Ministry.
Technically, the chart also suggests that the market did not believe Friday’s news and does not expect a favorable outcome or price growth in the near future.
The dollar is rebounding, while gold is forming a short squeeze at resistance.
Resistance levels: 4837, 4857
Support levels: 4785, 4729, 4700
After a false breakout, gold is closing below the local support level of 4837. A retest of 4837–4857 could trigger a sell-off and a decline toward the 4785 area of interest. A close below 4785 could intensify the sell-off toward 4730–4700.
Best regards, R. Linda! Short 
LTCUSDT - A break above resistance will trigger a rally BINANCE:LTCUSDT is testing the resistance level of its trading range amid a local uptrend sentiment among crypto traders
Bitcoin is forming a local bullish trend, which is supporting the growth of altcoins. However, LTC is in a global bearish trend with two triggers ahead: 55.7, a breakout of which could trigger a rally toward the upper boundary of the global trading range, which is quite likely to hold back further growth.
Locally, the focus is on the current H1 range: 52.5 – 55.7. The market is forming its fourth attempt to retest resistance, which generally increases the chances of a breakout and further growth toward 56.6 – 57.3
Resistance levels: 55.7, 56.67, 57.37
Support levels: 55.24, 54.7
Before rising, the price may form a long squeeze in the 55.2–54.7 zone. However, a breakout and close above 55.7 could trigger a rally.
Best regards, R. Linda!  Long
Long
Long 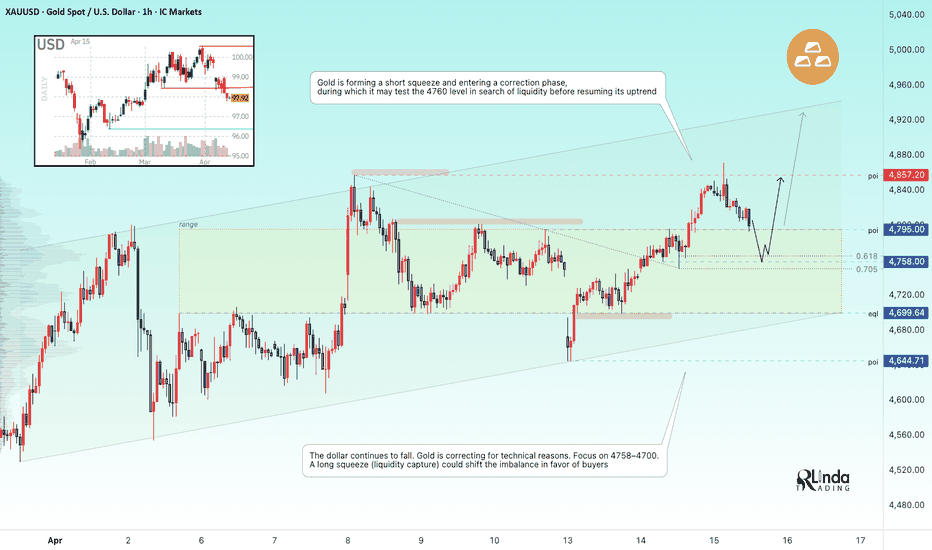
AUDUSD - Holding above 0.7100 could trigger a rally FX:AUDUSD is attempting to break through the consolidation resistance amid a weakening dollar due to geopolitical factors. The bullish trend may continue
The dollar is falling amid de-escalation in the Middle East. Markets are reversing, and the Australian dollar is strengthening.
Consolidation is forming against the backdrop of an uptrend. Compared to other pairs, this currency pair looks more poised to continue its upward movement. The price is breaking through resistance, and holding above the key level could trigger distribution
Resistance levels: 0.70950, 0.7143, 0.7168
Support levels: 0.7084, 0.7053
As part of the battle for resistance, a reversal pattern has formed, creating an intermediate bottom in the 0.7078 zone, confirming readiness for growth. Consolidation above 0.710 could support further growth toward 0.714
Best Regards, R. Linda! #TON MOVE LOOKS BULLISH… BUT IT’S A DANGEROUS TRAP
Yello Pariadisers! Are you prepared for another deceptive #TON move that could trap both impatient buyers and early sellers before the market reveals its true direction?
💎#TONUSDT is developing a corrective ABC structure after a sharp impulsive move to the downside. Wave B appears to be completed, and price is now transitioning into wave C, which suggests we could still see short-term upside before the main bearish trend continues.
💎Wave C typically unfolds as a five-wave structure, often creating misleading price action that tricks traders into thinking a full reversal is happening. In reality, this phase is where the market builds momentum for the next move and traps those who enter too early.
💎Price is moving inside an ascending channel acting as a temporary corrective structure. The upper boundary around 1.67 is acting as minor resistance, and if momentum continues, the next key level to watch is the major resistance around $1.8-$2.00.
💎This 2.00 level is critical because it acts as the invalidation point for the bearish bias. A strong breakout and sustained move above it would shift the structure entirely, but until that happens, this remains a corrective move within a broader downtrend.
💎On the downside, the lower boundary of the channel near 1.23 is acting as minor support. If this level breaks, the next key area to watch is around 1.13, which aligns with the low of the previous impulsive move and could act as the completion zone for wave C.
💎Overall, the market structure still points toward a corrective phase rather than a confirmed reversal. This is exactly where most traders get trapped by trying to anticipate the move instead of waiting for confirmation and proper structure.
Paradisers, strive for consistency, not quick profits. Treat the market as a businessman, not as a gambler.
MyCryptoParadise
iFeel the success🌴
#NEAR Is Approaching a Dangerous Trap Zone – Are you ready?
Yello Paradisers! -Could #NEAR be finishing its last bullish push before a much larger continuation of the downtrend?
💎#NEARUSDT forming a corrective ABC/WXY structure inside an ascending channel. Based on the wave structure, the market seems to be progressing through the final stages of wave C or wave Y and, more specifically, the fifth wave of that leg. This type of structure often signals that the corrective move is nearing completion.
💎The ascending channel has already formed a potential overshoot zone above its upper boundary. In many cases, the final wave of a corrective structure briefly pushes beyond the channel before reversing sharply. Since the broader trend of #NEAR remains bearish, this entire upward movement is most likely just wave 4 within the larger downtrend, rather than the start of a new bullish phase.
💎At this stage, wave C or Y could unfold in two possible ways. It may develop as an ending diagonal, which is common near the end of corrective trends, or it could complete as a standard five-wave impulsive structure. The market will reveal the exact structure as price action develops, but both scenarios suggest that the upside is becoming limited.
💎The most interesting area for a potential short bias lies in the overshoot zone above the upper boundary of the ascending channel. If price completes wave 5 in this region, it could present a very attractive risk-to-reward opportunity for traders looking to align with the broader bearish trend.
💎From a key level perspective, the top of wave 3 near $1.45 acts as the first minor resistance zone. Above that, the major resistance level sits around $1.63, which could serve as the final exhaustion area if the fifth wave extends further.
💎On the downside, the first important support level is located near $0.97, which corresponds to the previous wave B or X low. The major structural support is near $0.84, where the ascending channel originally began. If price breaks below this level decisively, it will strongly confirm bearish continuation and could open the door for a deeper extension of the downtrend.
💎That is why we always focus on patience and high-probability setups. The market often completes its final corrective wave before trapping late buyers, and identifying those moments is where disciplined traders gain their edge.
Paradisers, strive for consistency-not quick profits. Treat the market as a businessman, not as a gambler. This is the only way you will make it far in your crypto trading journey. Be a PRO.
MyCryptoParadise
iFeel the success🌴  Short
Short
Long 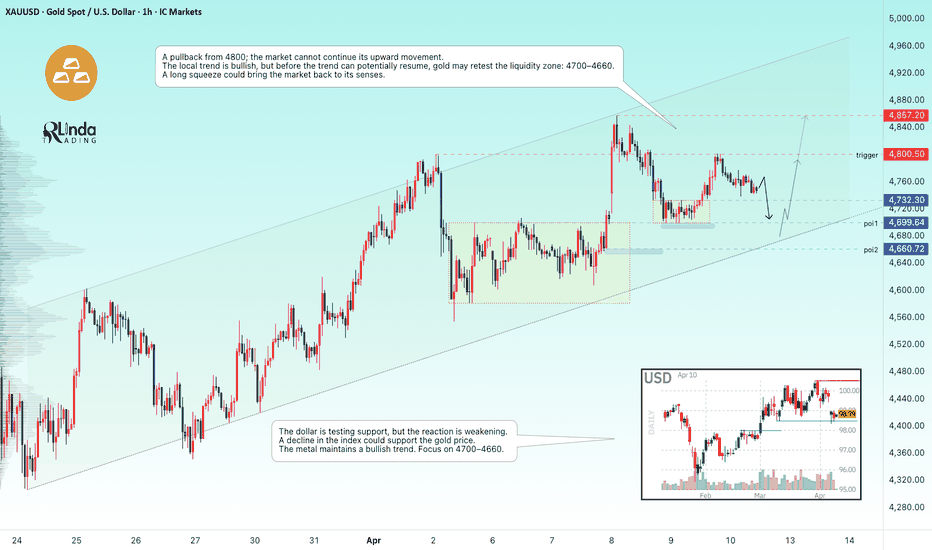
 Short
Short
 Long
Long
BITCOIN - 72K Retest: Are We Poised for Growth?BINANCE:BTCUSDT.P is rallying from $67,700 due to a local shift in the fundamental landscape in the Middle East. The flagship cryptocurrency is testing $72,000
The de-escalation of the conflict and the temporary pause have had a positive impact on the S&P 500 and Nasdaq indices, which in turn has affected the cryptocurrency market, making them more attractive amid falling oil prices and a weakening dollar
Bitcoin is testing 72K; Tuesday’s session is closing fairly close to this level, and the price’s reluctance to decline signals potential upside momentum. If consolidation continues, this will be a positive sign for a possible breakout above 72K. A close above this level could trigger a rally toward 74K–75K
Resistance levels: 72,000, 74,000
Support levels: 71,200, 70,250
However, it cannot be ruled out that the market may form a correction (due to liquidity) with the aim of closing the imbalance zone and testing the 70,253 support level before rising.
Best regards, R. Linda! Long 
GOLD - Consolidation amid a bullish trend. Trigger at 4700 ICMARKETS:XAUUSD is consolidating above 4,600 as part of a local uptrend. The dollar is in a correction, and the market is picking up on subtle hints of potential negotiations regarding the Middle East...
There are hints of potential negotiations; Trump may withdraw his ultimatum. If this is confirmed, the market may react positively.
The dollar has been in a correction for two days, which is supporting the metal’s price. Focus on the local range of 4601–4700. Gold is retesting resistance (trigger) at 4700; the reaction is important to me. If there is no pullback and the market holds near this zone, a break above 4700 could trigger further growth toward 4800.
Resistance levels: 4700, 4793, 4800
Support levels: 4650, 4600, 4555
Further growth depends on geopolitics. A retest of 4600 before a rally cannot be ruled out, as a large liquidity pool has formed below 4600
Best Regards, R. Linda! Long 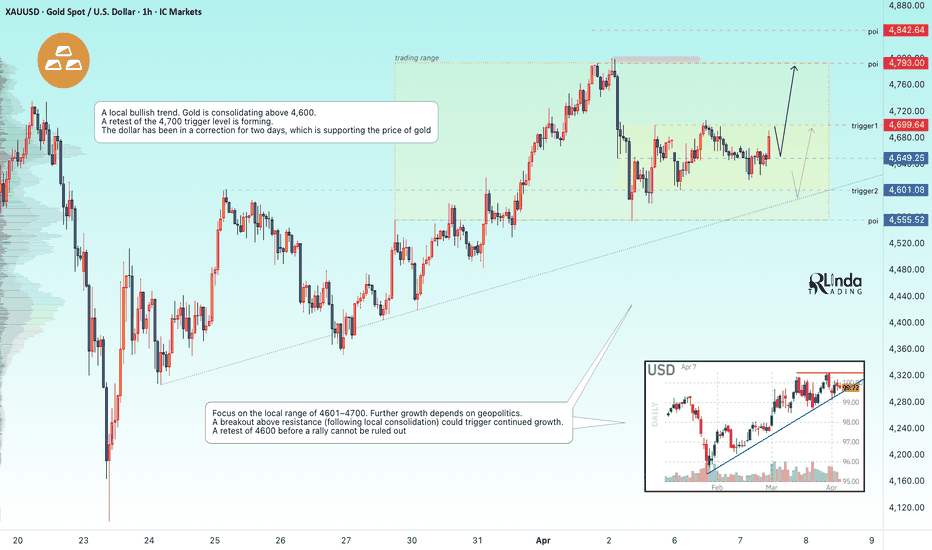
GOLD - Consolidation near the trigger. Uptrend and newsFX:XAUUSD is trading near key resistance at 4,735, finding support from a weaker dollar amid hopes for a de-escalation of the conflict in the Middle East
Key factors: Trump did not anticipate this turn of events in the Middle East, shifting responsibility for the strait to NATO countries. Earlier this week, the president stated that he was ready to end the war even without opening the strait.
A lot of economic news is expected today.
ADP Employment Change – a reading below the forecast will increase pressure on the dollar and lower expectations for a Fed rate hike.
The main event of the week: Nonfarm Payrolls (NFP) on Friday (Good Friday).
Risk appetite has reduced demand for the dollar as a safe haven, which has supported gold.
Gold is recouping its March losses amid a combination of geopolitical optimism and weak signals from the U.S. labor market. Holding above $4,700 will pave the way for further recovery
Resistance levels: 4735, 4866
Support levels: 4683, 4600
The false breakout of resistance elicited virtually no reaction (drop). Gold is consolidating near this level. If, during this consolidation, the market manages to break through 4735 and close above that level, the market will have an opportunity to rally. Otherwise, a retest of 4600 is possible amid news-driven volatility.
Best regards, R. Linda! Long 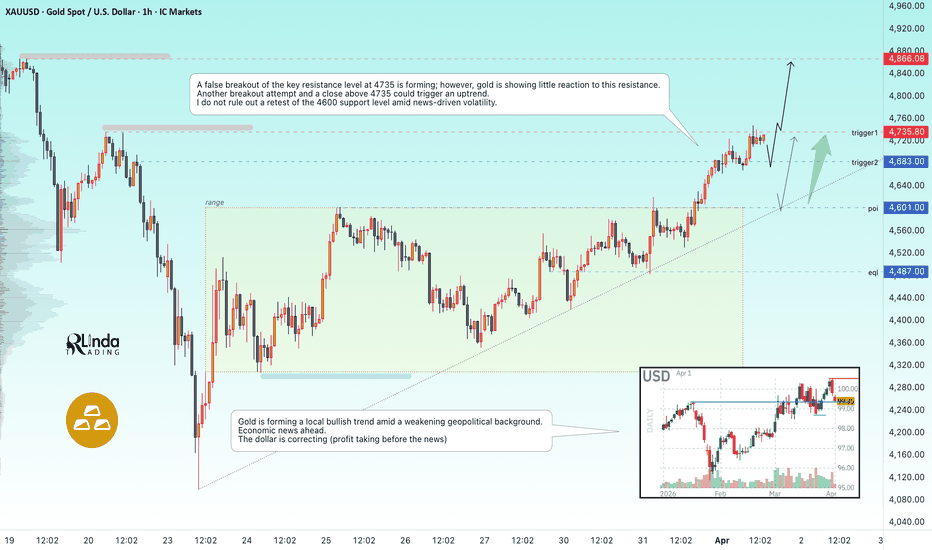

 Long
Long