NZDUSD - Ready for growth within the trend Following a strong rally, FX:NZDUSD is now retesting the former resistance of its trading range, which has turned into support. This creates an opportunity for the bullish trend to continue.
The U.S. Dollar Index has broken its recent market structure, and continued dollar weakness could provide additional support for the pair
From a technical perspective, NZDUSD is performing a classic support retest within its countertrend recovery, while buyers are actively defending the 0.5863 level. Sustained consolidation above this trigger could become the catalyst for another bullish impulse
Resistance levels: 0.5908, 0.6000
Support levels: 0.5863, 0.5825
As long as price remains above 0.5863, the pair has the potential to extend its recovery, supported by the current weakness in the U.S. Dollar Index
Best regards,
R. Linda EURJPY - Long squeeze on support amid a bullish trend FX:EURJPY has fallen sharply following the Bank of Japan's intervention, triggering a long squeeze below key support. A recovery back into the trading range could provide the foundation for a bullish rebound
The market is currently stabilizing after the sharp decline, with price testing what was previously the daily range support, now acting as resistance.
A move back above the 180.80 level, followed by sustained consolidation, would confirm the recent breakdown as a false breakout and could trigger a bullish impulse
Resistance levels: 182.10, 183.56
Support levels: 180.80, 179.50
If buyers manage to reclaim and hold 180.80, the pair could regain upside momentum, opening the way for a recovery toward the next resistance levels
Best regards,
R. Linda  Long
Long
Three tries at 0.9890. Wednesday's CPI decides the fourthAUD/CAD - long swing setup, ARMED (1D)
THE SETUP
AUD/CAD has run into the same ceiling three times this month. The daily highs print at 0.98874, 0.98890 and 0.98882 - 1.6 pips between the highest and the lowest, which is close enough to call it one price. Underneath it the lows keep rising: 0.97613, then 0.98024, then 0.98079, then 0.98463 today. Flat top, rising floor. That is an ascending triangle, and the coil is tight enough that ADX has dropped to 13.2 while all twelve moving averages I track sit below price.
I am not long yet. This arms on a daily close above 0.9890.
CONFLUENCES
- Trend agrees: price above all 12 MAs, the 200 EMA is 275 pips below at 0.96023
- Flat resistance tested three times inside 1.6 pips
- Four consecutive higher lows compressing into it
- RSI 55, so momentum is with the trend but nowhere near overbought. Room to run
- A dated catalyst that points the same way as the trade
- Clean invalidation: no close above 0.9890 means no trade and nothing risked
FUNDAMENTALS
Australian Q2 CPI lands Wednesday 29 July. Trimmed mean is expected at 3.7% against 3.5% prior, and June employment already surprised hard at +76.3K, which pushed pricing toward an RBA hike on 11 August. The other leg is asleep: the Bank of Canada held at 2.25% in July for a sixth straight meeting and does not meet again until 2 September. One side has a catalyst, the other has none.
The risk cuts both ways. A soft CPI removes the August hike case and this triangle likely resolves downward instead. That is precisely why there is a trigger rather than a position.
TRADE PLAN
Trigger: daily close above 0.9890
Entry zone: 0.9884 - 0.9893
Stop loss: 0.9840 (below the last higher low at 0.98463)
TP1: 1.0000, parity (+1.12% | 2.2R)
TP2: 1.0017, the measured move - triangle height is 128 pips (+1.29% | 2.6R)
Watch 0.9944, the June high, for friction on the way. I scale there rather than treat it as a target.
Invalidation: no daily close above 0.9890.
Every call I publish goes in the public scorecard, wins and losses both.
So which are you: take the close above 0.9890, or wait for CPI to print and pay up for the certainty?
Not financial advice. Trade your own plan and manage risk. ETHUSDT: ascending triangle long into the $2K short wallETHUSDT — Long swing setup (1D)
THE SETUP
ETH has built a clean staircase of higher lows through July (~1,450 to 1,600 to 1,700 to 1,800 to now ~1,870) while capped by the $2,000 round number — an ascending triangle. Rising demand into fixed resistance is a bullish continuation structure, and $2,000 is stacked with shorts (reports cite ~$975M above $1,952). A reclaim would force covering — squeeze fuel.
CONFLUENCES
- Daily uptrend intact: higher lows, structure unbroken above $1,800
- Entry at rising support / prior structure, $1,845–$1,880
- Ascending triangle: flat $2,000 resistance + rising lows
- Funding positive but not overheated — room to run
- Whale accumulation (10k ETH off Binance; a16z 25k+ ETH) into a heavy short cluster
- Clean invalidation below $1,800, RR ~1.8:1 to TP1
FUNDAMENTALS
Whales and long-term holders accumulated on exchange outflows through late July while ~$1–2B of shorts sit at/above $2,000. Glamsterdam upgrade targeted H2 2026. Note: spot ETH ETFs saw net outflows recently — a mixed signal, which is why the $1,800 invalidation is firm.
TRADE PLAN
Entry zone: 1,845 – 1,880
Stop loss: 1,795 (below the $1,800 July higher-low structure)
TP1: 1,985 (+6.6% | ~1.8R)
TP2: 2,100 (+12.8% | ~3.5R)
TP3: 2,250 (+20.8% | ~5.8R)
Invalidation: a daily close below $1,800 kills the idea.
Follow for the daily levels — updates posted on this idea as it plays out.
Not financial advice. Trade your own plan and manage risk.  Long
Long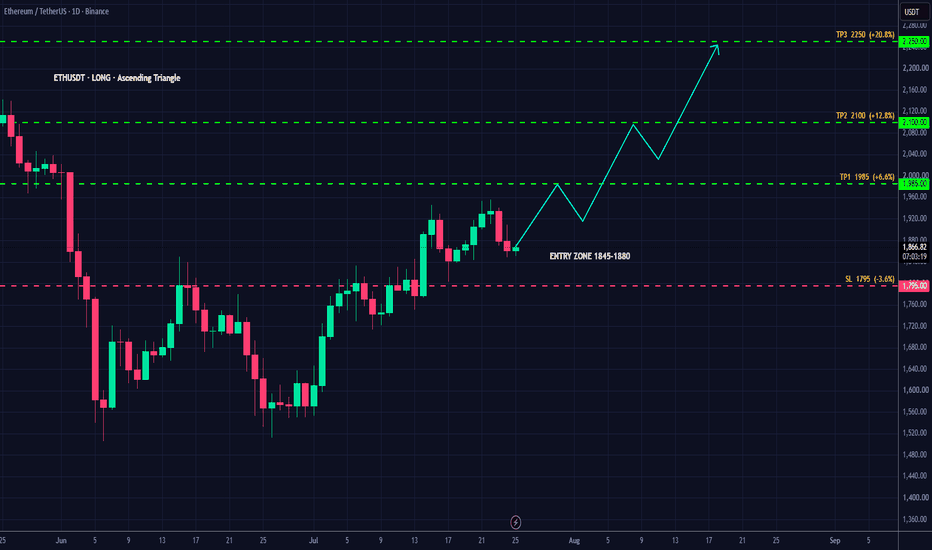
ETHUSDT - The Battle for a Key Support Zone BINANCE:ETHUSDT.P is showing local bullish momentum and appears stronger than Bitcoin in the current market environment. Price action is focused on the 1800–1850 zone, where buyers and sellers are competing for control
Bitcoin remains in consolidation between 61,000 and 65,000, while the broader market trend is still bearish. The lack of both fundamental and technical support continues to weigh on the crypto market as a whole.
From a technical perspective, Ethereum has broken above resistance, confirming a short-term bullish structure. During the ongoing correction, price is respecting the local trendline while testing the 1808–1848 area of interest
Resistance levels: 1848, 1946, 1966
Support levels: 1833, 1807, 1774
The key trigger remains 1848. If bulls can establish sustained consolidation above this level, it could become the technical catalyst for a move toward 1945–1966
Best regards,
R. Linda Long 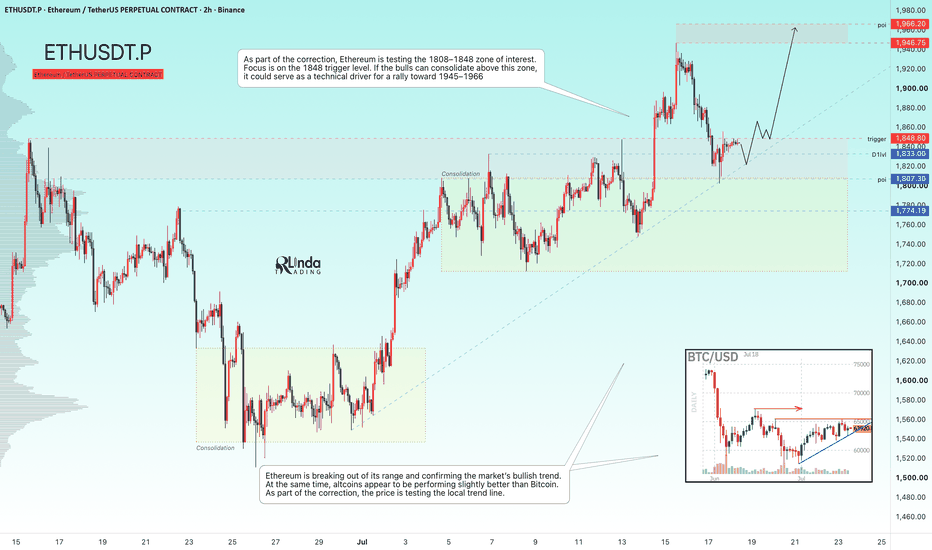
 Long
Long
EURUSD - Retest of support at 1.143–1.140 before distribution FX:EURUSD is showing early bullish signals. The pair is breaking above the 1.1434 resistance cluster and the descending trendline, opening the door for a potential continuation higher
The latest FOMC minutes did not deliver a clear hawkish message, with markets pricing in only a 25–30% probability of a July rate hike. Meanwhile, the 1.1400 support continues to provide a solid base for a technical rebound. However, renewed geopolitical tensions in the Middle East continue to support the U.S. dollar as a safe-haven asset
The ECB is widely expected to remain on hold in July, while the Fed still retains the option of another rate hike. Technically, the U.S. dollar is showing a limited reaction to recent news and appears vulnerable to a corrective pullback, which could provide additional support for the euro following the false breakout below support and the breakout above consolidation resistance
Resistance levels: 1.1477, 1.1528
Support levels: 1.1434, 1.1400
The pair is also confirming a false breakout below the major weekly (W1) support. The prolonged battle around 1.1400 highlights persistent buying interest. Locally, EURUSD is breaking above the 1.1434 consolidation resistance and the descending corrective trendline. If bulls can hold 1.1434 as new support, the pair could extend its advance toward 1.1478 and 1.1528
Best regards,
R. Linda HYPEUSDT - Consolidation Before Further Growth BINANCE:HYPEUSDT.P is consolidating within both its local and global bullish trends. Technically, this phase appears to be a period of accumulation before a potential continuation of the uptrend
Bitcoin is currently caught between three major forces: the Fed's softer rhetoric, a reversal in ETF flows, and renewed geopolitical tensions in the Middle East. While Bitcoin remains in a countertrend correction within its broader bearish trend, HYPE continues to show relative strength. The market is forming two key trigger levels around the boundaries of the current trading range: 72.09 and 68.30
Resistance levels: 72.09, 77.00
Support levels: 68.30, 65.60
Technically, two scenarios remain in focus before the next bullish leg. The first is a retest of resistance followed by a breakout, where consolidation and a close above 72.09 could trigger further upside. Alternatively, the market may first perform a long squeeze below the 68.30 support level before resuming its upward trend
Best regards,
R. Linda  Long
Long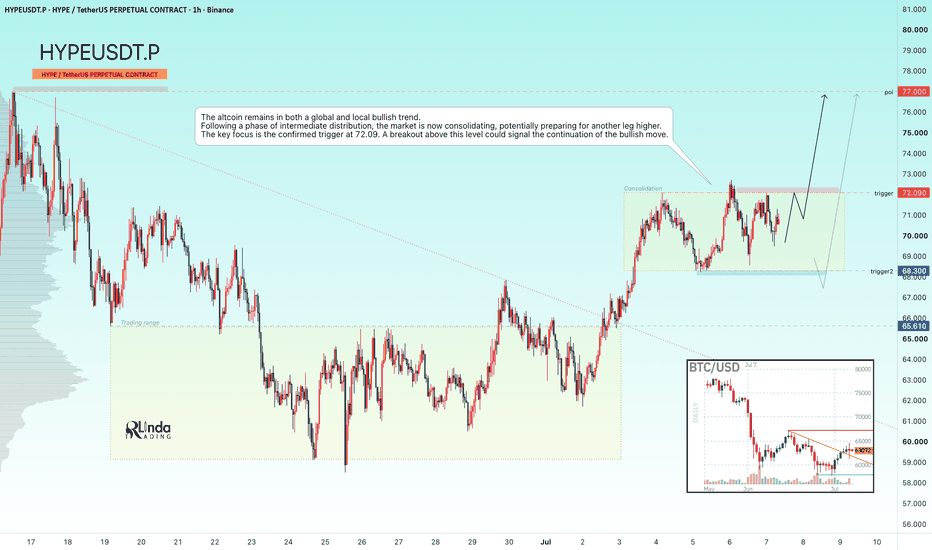
GOLD - A pullback before a potential rise to 4220 Following the breakout above the 4100 consolidation range and the recent rally, ICMARKETS:XAUUSD has entered a corrective phase. The geopolitical and fundamental backdrop remains unstable
Gold staged a strong recovery after weaker-than-expected U.S. employment data shifted Fed expectations from hawkish to more neutral. The probability of a September rate hike has fallen from 66% to around 53–55%, while the U.S. dollar has stalled and Treasury yields have declined, creating favorable conditions for a rebound after gold's sharpest quarterly drop in years.
However, with the start of the new trading week, gold has temporarily lost momentum due to renewed geopolitical developments. Market attention is now focused on headlines from the Middle East and the return of liquidity following the U.S. holiday weekend.
Key drivers:
Bearish for gold: stronger U.S. dollar, renewed geopolitical risks, profit-taking after the recent rally.
Bullish for gold: weaker U.S. dollar, progress in geopolitical negotiations, and the return of market liquidity after the U.S. holidays
Resistance levels: 4198, 4220
Support levels: 4144, 4121, 4095
Technically, market makers may target a retest of the 4198–4220 liquidity zone and the recent swing high. However, both the Asian and European sessions are currently favoring a corrective move and a liquidity hunt before another potential rally. A long squeeze into the 4144–4121 support zone could trigger another bullish impulse.
However, keep in mind that both the local and the broader market trends remain bearish.
Best regards,
R. Linda  Long
Long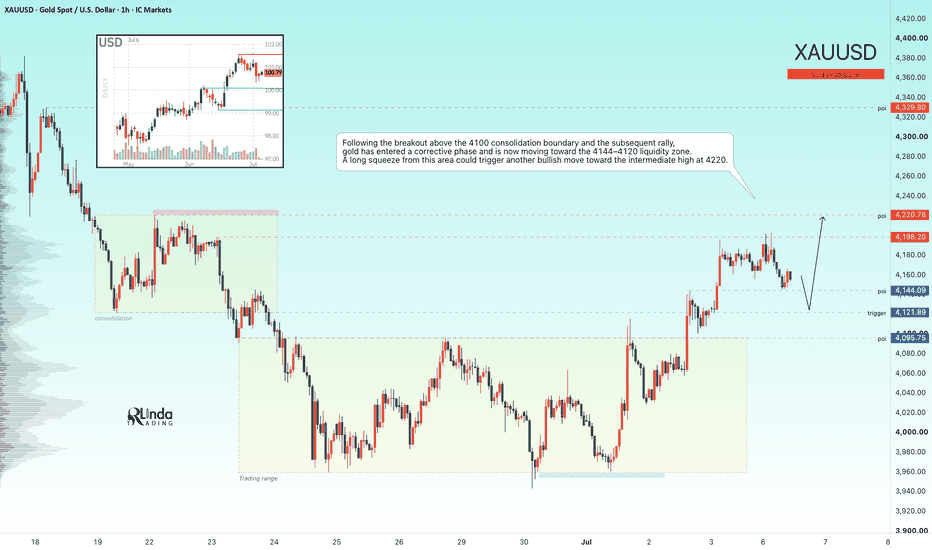
EURJPY - A Breakthrough of Resistance to Continue the Uptrend FX:EURJPY is testing the 184.84 support level after breaking above a key resistance. The broader trend remains bullish, providing overall support for further upside
EURJPY is currently influenced by three major factors: a widening interest rate differential in favor of the euro, persistent bearish positioning on the Japanese yen as large speculators continue to increase short exposure, and growing risks of a Japanese currency intervention amid the yen's weakest levels in decades. Despite these factors, the technical structure remains favorable for further gains.
The chart is forming a classic breakout pattern, with price holding above the former resistance level
Resistance levels: 185.37, 186.32
Support levels: 184.84, 184.57
Following a pullback from 185.37, the pair is testing the 184.84 support and liquidity zone. Within the broader bullish trend, if bulls manage to defend this trigger level, it could pave the way for another leg higher
Best regards,
R. Linda  Long
Long
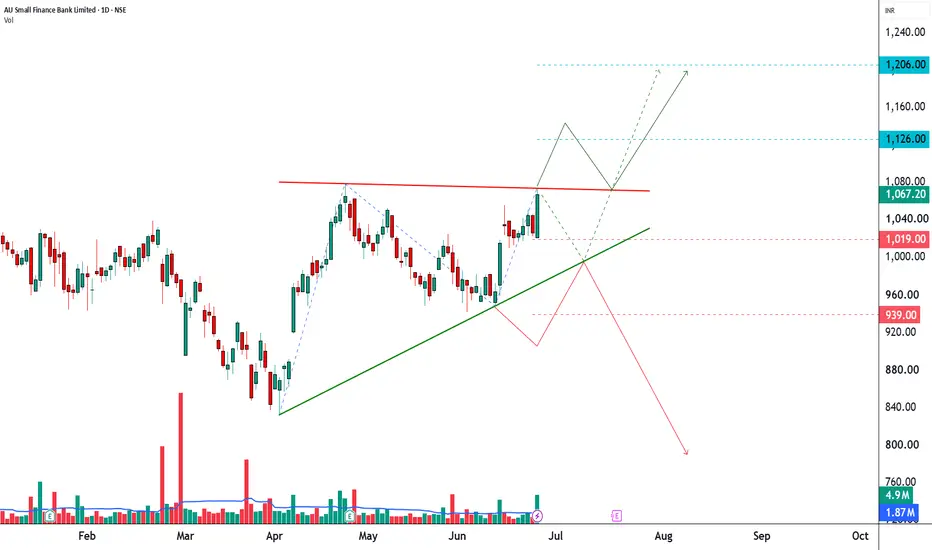
CIPLA: 278-Point Compression Near a Major Resistance Zone🔥 CIPLA: 278-Point Compression Near a Major Resistance Zone — Expansion Ahead? 📊
Cipla Limited (CIPLA) is currently trading within a tight price structure just below a key resistance area at 1,444.50. As price continues to compress beneath this supply zone, the chart is approaching a point where a larger directional move may begin to develop.
________________________________________
📐 Understanding the Current Structure
What makes this setup particularly interesting is that it can be viewed in two different ways.
Automated View
Many pattern-detection algorithms identify the current formation as a Rising Wedge, a structure created when both highs and lows continue to rise while the price range gradually narrows.
Discretionary Price Action View
When viewed manually, the same chart also displays characteristics of a classic Ascending Triangle, with price repeatedly testing a horizontal resistance zone while forming higher lows underneath.
Some traders may also recognize elements of an Inverse Head & Shoulders accumulation structure within the broader pattern.
This creates a fascinating case of structural duality, where automated and discretionary analysis arrive at different interpretations of the same price action.
________________________________________
📊 Key Structural Reference Points
Pivot A: 1,409.50
Pivot B: 1,165.70
Pivot C: 1,444.50
Pivot D: 1,341.10
Spatial Measurements
Measured Spatial Depth: 278.80 Points
Technical Upper Horizon: 1,723.00
Technical Lower Horizon: 1,062.00
These levels are derived from historical price structure and are intended as analytical reference zones.
________________________________________
📉 Volume & Compression Profile
One of the most important observations is the ongoing reduction in volatility as the pattern matures.
Price continues to trade within a narrowing range while repeatedly interacting with the 1,444.50 supply area. This type of compression often attracts attention because it reflects a temporary balance between buyers and sellers.
A future expansion in participation and volume may help confirm the next phase of market structure.
________________________________________________________________________________
🔍 Conditional Horizons
Scenario Structural Condition Reference Horizon
Upside Ref Daily close above 1,444.50 Technical Upper Horizon:
supported by increased volume participation 1,723.00
Downside Ref Failure to maintain higher lows Technical Lower Horizon:
followed by deterioration in structure 1,062.00
________________________________________________________________________________
At present, the chart remains in a consolidation phase and neither scenario can be considered active until price provides further confirmation.
________________________________________
⚠️ Structural Invalidation Parameters
For the Ascending Triangle Interpretation
Pivot D (1,341.10) remains an important structural support area.
Sustained weakness below this zone would reduce the strength of the higher-low sequence.
For the Broader Structure
Pivot B (1,165.70) represents a major structural reference point.
A move below this level would significantly alter the current long-term pattern framework.
These levels are useful for monitoring whether the existing structure remains intact.
________________________________________
📊 Technical Perspective
CIPLA currently sits at an interesting intersection between two different pattern interpretations.
The automated view favors a Rising Wedge structure, while the underlying price behavior continues to resemble an Ascending Triangle with repeated tests of a horizontal supply ceiling.
As the price range continues to tighten, market participants may focus closely on how the stock behaves around 1,444.50, as this remains the most important structural level on the chart.
________________________________________
📚 Educational Note
This publication demonstrates how the same chart can produce different interpretations when viewed through automated pattern recognition and discretionary price-action analysis. The purpose of this study is educational and informational only.
________________________________________
💬 Community Discussion
Which interpretation do you find more convincing here?
Do you favor the automated Rising Wedge perspective, or do you believe the repeated tests of the 1,444.50 horizontal supply wall reflect a stronger Ascending Triangle accumulation structure?
Share your view below.
________________________________________
Disclaimer:
This publication is intended solely for educational and informational purposes. The analysis is based on chart structure and historical price action and should not be considered investment advice, trading advice, research advice, or a recommendation to buy, sell, or hold any security. Market conditions can change without notice, and all decisions should be made after independent research and appropriate risk assessment.
 Long
Long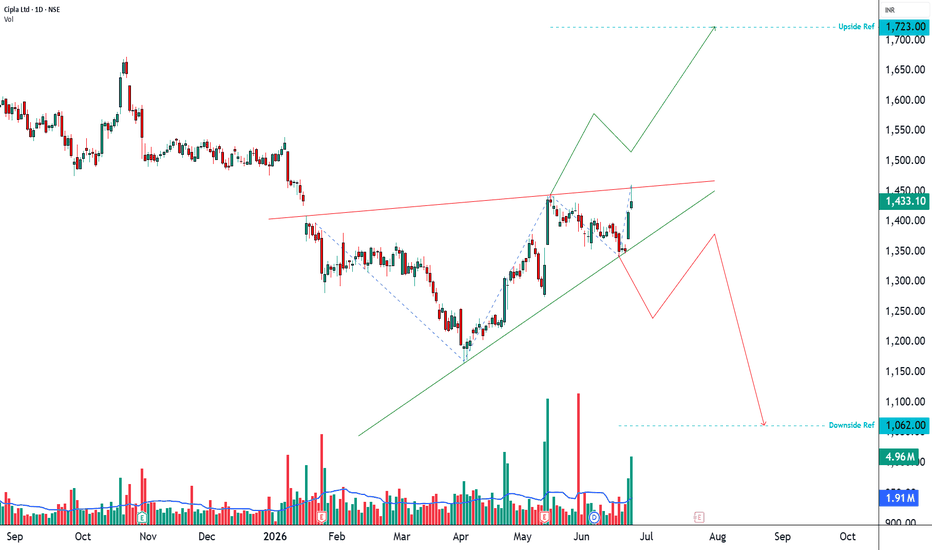
ICICIGI Three White Soldiers Within a Large Ascending Triangle📊 ICICI Lombard General Insurance: Daily Technical Snapshot – Three White Soldiers Emerging Within a Large Ascending Triangle
📊STWP Equity Snapshot
________________________________________
MARKET STRUCTURE SNAPSHOT | NSE: ICICIGI | DAILY
________________________________________
• Closing Price: 1,839.00 (+48.50 | +2.71%)
• Core Trend: Downtrend (Weakening) / Recovery Structure Emerging
• Market State: Consolidation Near Breakout Zone
• Price Structure: Ascending Triangle Formation with bullish reversal characteristics
________________________________________
OPERATIONAL PRICE GRID & KEY REFERENCE LEVELS
________________________________________
• Model Reference Level: 1,844.00
• Hard Invalidation Level: 1,669.50
• Structural Risk: 174.50 (9.46%)
• Resistance Levels: R1 1,860.23 | R2 1,881.47 | R3 1,918.90
• Support Levels: S1 1,801.53 | S2 1,764.07 | S3 1,742.83
• Range Structure: Low 1,671.80 | High 1,908.90
• Higher Timeframe Observation Zones: 2,018.50 | 2,193.00
________________________________________
MOMENTUM, PARTICIPATION & CPR DATA
________________________________________
• Volume Profile: 539.56K Shares
• Volume Character: Normal Participation
• RSI Metric: 58.80 (Bullish Momentum Recovery)
• ADX Reading: 12.78 (Weak Trend Environment)
• ROC: +6.12%
• MACD Status: Recovery Phase | Momentum Improving
• Stochastic Reading: 97.10 (Strong Momentum Zone)
• Current Bias: BUY ON PULLBACKS
• CPR State: Bullish Zone | CPR Moving Up (Wide)
• Today's CPR: Pivot 1786.20 | Top 1788.35 | Base 1784.05
• Tomorrow's CPR (Projected): Pivot 1822.75 | Top 1830.90 | Base 1814.65
________________________________________
📚 EDUCATIONAL OBSERVATION
________________________________________
ICICI Lombard is displaying a constructive technical structure after spending several months consolidating within a broad contracting range. Price action has developed into what appears to be a large Ascending Triangle pattern, characterized by rising lows and a relatively stable resistance zone near the 1,900 region. Such formations often reflect gradual accumulation as buyers become increasingly willing to absorb supply at higher prices.
The dashboard identifies a Three White Soldiers pattern with an estimated reliability of approximately 64%, suggesting a strong bullish reversal signal following a period of weakness. Recent candles demonstrate improving buyer participation, with price recovering sharply from the lower boundary of the triangle and approaching the upper resistance region once again.
Momentum indicators are beginning to support the improving structure. RSI has recovered to 58.80 and remains comfortably above the neutral zone, indicating strengthening buying pressure. ROC has turned positive at 6.12%, while Stochastic readings near 97 reflect strong short-term momentum. ADX remains relatively low at 12.78, indicating that a powerful directional trend has not yet fully developed despite the recent improvement in price behavior.
The projected CPR structure remains bullish and has shifted higher, with tomorrow's Pivot projected near 1,822.75. Rising CPR structures generally indicate improving market acceptance of higher price levels and often support continuation moves when price remains above the projected range.
From a broader structural perspective, the most important level remains the descending resistance trendline near the 1,900–1,920 zone. A decisive breakout above this region could complete the larger Ascending Triangle structure and potentially shift market focus toward the higher timeframe observation zones near 2,018 and 2,193. Until such a breakout occurs, the stock remains in a consolidation-to-recovery phase rather than a confirmed expansion phase.
From a business perspective, ICICI Lombard continues to benefit from growing insurance penetration in India, increasing awareness of health and general insurance products, and long-term expansion opportunities within the domestic insurance sector. While technical analysis remains the primary focus of this report, the broader sector backdrop remains supportive for long-term growth.
Support and resistance levels should be treated as observation zones rather than predictive targets. Chart patterns, momentum indicators, volume analysis, and CPR frameworks are educational tools that help market participants understand evolving market structure within a disciplined risk-management framework.
________________________________________
⚠️ Disclaimer
________________________________________
• This analysis is provided strictly for educational and informational purposes.
• This is not financial, investment, or trading advice and should not be considered a recommendation to buy or sell any security.
• Stock market investments are subject to market risks, including the possible loss of capital.
• Past performance, historical observations, chart patterns, and technical indicators do not guarantee future results.
• Please conduct your own research and consult a SEBI-registered financial advisor before making investment decisions.
• STWP assumes no responsibility or liability for any financial loss arising directly or indirectly from the use of this information.
 Long
Long
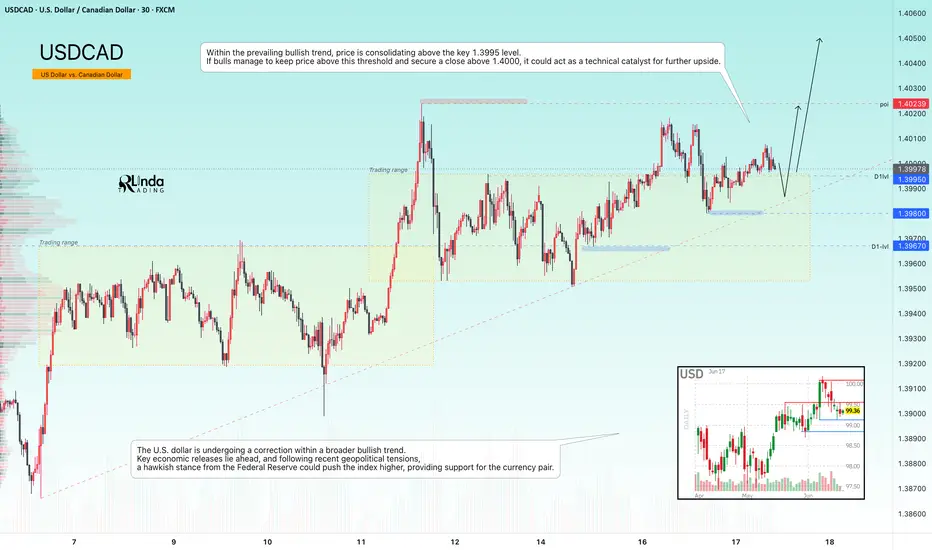
USDCAD - Retest of 1.40. Markets are awaiting the Fed's decisionFX:USDCAD maintains a strong bullish trend and is testing the 1.4000 resistance level while attempting to hold above this key threshold. The Federal Reserve meeting is now in focus
USDCAD has entered a consolidation phase ahead of major news events, with the primary focus on the Fed's interest rate decision and comments from the new Fed Chair
The U.S. dollar is currently correcting within a broader bullish trend. With key economic releases approaching and geopolitical tensions still in the background, a hawkish stance from the Federal Reserve could push the Dollar Index higher, providing additional support for the currency pair.
Resistance levels: 1.4000, 1.4024, 1.4100
Support levels: 1.3995, 1.3980, 1.3967
Within the prevailing bullish trend, price is consolidating above the key 1.3995 level. If bulls manage to defend this area and secure a close above 1.4000, it could become a technical catalyst for further upside
Best regards,
R. Linda

 Long
Long