Bitcoin 20k
**Bitcoin Shark**
(Tune: Baby Shark)
Bitcoin, doo doo doo doo doo doo
Bitcoin Shark!
Buy the dip, doo doo doo doo doo doo
Bitcoin Shark!
To the moon, doo doo doo doo doo doo
Bitcoin Shark!
HODL strong, doo doo doo doo doo doo
HODL strong, doo doo doo doo doo
Bearish Shark
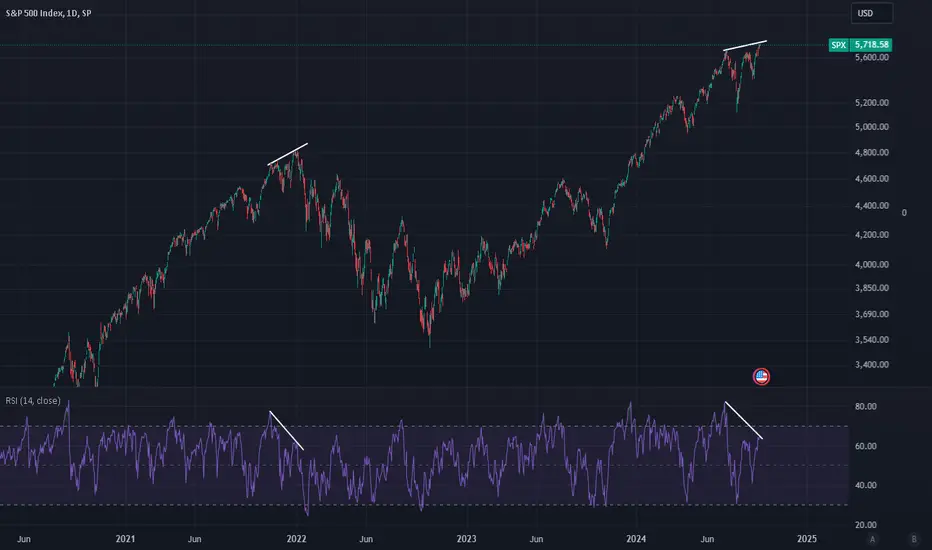
Major Top Forming on SPXHello Everyone, a simple analysis of the RSI and current price action appear eerily similar to the 2022 peak. During the 2022 top we had financial experts and the media claiming victory stating that this bull market will continue, however we crashed soon after. Now the SPX is currently forming a topping process, this could be done or we could go a little higher before the bear market continues. It's clear that the SPX is making new highs while NDX and IWM fail to make a new high suggesting that
Second Chance Shorting Opportunity on EURUSDIf you’re looking for a second chance to short EURUSD, there’s a promising setup involving a Type 2 Bearish Shark Pattern with RSI Divergence. Let’s break it down.
Current Overview:
- Type 2 Bearish Shark Pattern:
- What It Means: The first target has already been achieved. This provides clarity on the first target but might reduce participation since the initial group of traders who profited may not re-engage.
- RSI Divergence:
- Signal: This divergence adds another layer of confirm
Second Attempt at Shorting NZDUSDI’m back at it with a second attempt to short NZDUSD, and here’s why this setup caught my attention.
Current Overview:
- 4-Hourly Chart:
i) Rising Channel: The pair is moving within a rising channel.
ii) RSI Divergence: This divergence signals a potential weakening of the uptrend, which adds confidence to the short setup.
Shorting Opportunity:
- 1-Hourly Chart:
i) Type 2 Bearish Shark Pattern: This pattern gave me a solid entry at 0.6029.
Strategy:
- 1st Target:
i) Extended
Trading Idea: Bearish Shark Setup on NZDUSDI wanted to share an interesting setup on NZDUSD that’s been forming for a while. Let’s dive into the details!
Current Overview:
Bearish Shark Setup:
Potential Reversal Zone (PRZ) : The setup has been hovering at the PRZ, which some traders might misinterpret as a violation.
Key Insights:
Having the Right Knowledge Matters : From my 19 years of trading and nearly 16 years of coaching, I’ve seen even experienced traders make mistakes in reading signals like this. It’s not uncommon for t
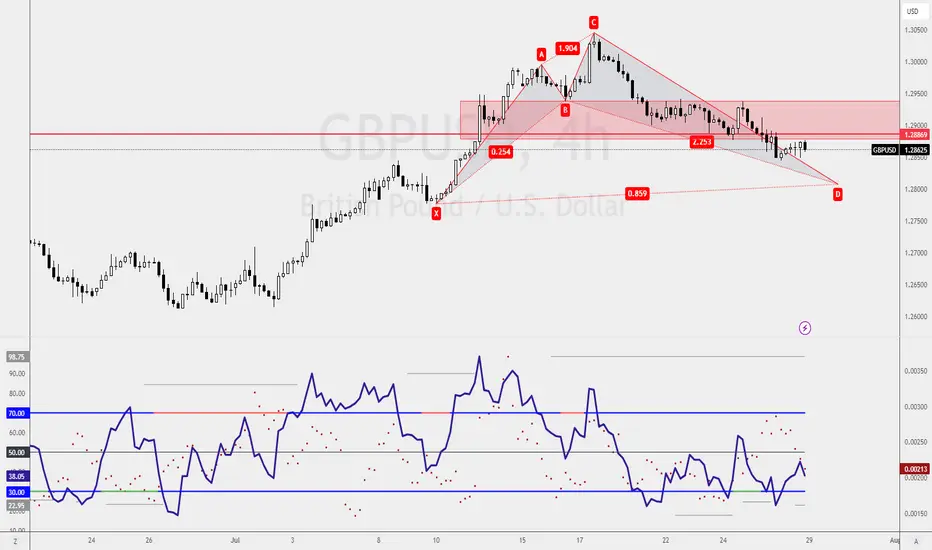
Buying Opportunity on GBPUSDIf you're looking for a buying opportunity on GBPUSD like I am, there’s an exciting setup to keep an eye on.
Current Overview:
4-Hourly Chart:
- There’s a Bullish Shark Pattern nearing completion, which is a great setup for a potential buy.
Buying Opportunity:
Bullish Shark Pattern Completion:
- Key Level: 1.2807
- What to Do: Wait for the Bullish Shark Pattern to complete at 1.2807.
Strategy:
1. Magic Candle Confirmation: This is crucial! Wait for the Magic Candle Confirmation at 1.2807 befo
Buying Opportunities on EURUSDHere’s an exciting update on EURUSD, which has just broken out of consolidation on the weekly chart. Let’s explore the buying opportunities available.
Weekly Chart:
EURUSD has broken and closed above the consolidation, signaling a potential upward trend.
Buying Opportunities on the 4-Hourly Chart:
1. Support Level:
- Key Level: 1.0843
- What to Do: Look for a buying opportunity at this support level.
2. Bullish Shark Pattern:
- Pattern Completion Level: 1.0820
- What to Do: Wa
GBPUSD Breakout and Bullish Shark Pattern!I hope you’re all doing well and staying sharp in the markets. I wanted to share an interesting setup I’ve been eyeing on GBPUSD that could be a great opportunity for both new and experienced traders alike.
What’s Happening?
- Weekly Chart:
- GBPUSD has finally broken out from its sideways consolidation, which is super exciting! This breakout could mean we’re in for some upward action.
The Plan:
On the 1-hourly chart, I’ve spotted a Bullish Shark Pattern. This pattern is a fantastic tool f
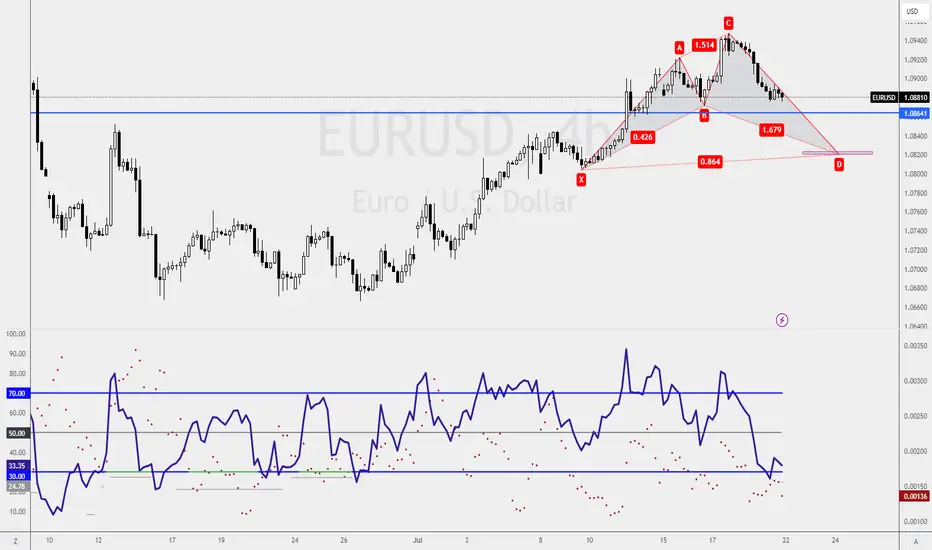
Long Opportunities on EURUSDIf you are looking to long EURUSD just like me, the 4-hourly chart presents a promising Bullish Shark buying opportunity. Here's how we can approach it:
Bullish Shark Pattern:
- Pattern Completion Level: 1.0820
- Strategy: Wait for a Magic Candle Confirmation at 1.0820 before entering a long position.
- Stop-Loss: Place a stop-loss just below the pattern completion level.
Support and Resistance Level:
- Support Level: 1.0864
- Strategy: Look for a buying opportunity at this support level.
Classic Support and Resistance with Harmonic Pattern on USDCADUSDCAD has a classic support and resistance line on the 1-hourly chart. Here are two approaches depending on your trading style.
Classic Support and Resistance Levels:
Shorting Opportunity:
- Resistance Level: 1.3691
- Strategy: Look for a shorting opportunity at this resistance level.
- Stop-Loss: Place a stop-loss just above the resistance.
- Target: Aim for the support level at 1.3641 or below.
Buying Opportunity:
- Support Level: 1.3641
- Strategy: Look for a buying opportunity at th
Potential BOJ Intervention and Technical Setups on USDJPYIf you haven't heard the latest news, Japan's Finance Minister and the BOJ have differing views on the intervention of the Japanese Yen. The Finance Minister believes that FX intervention didn't work, while the BOJ has stated they are prepared to intervene at any time and could catch the market by surprise.
Having traded for 18 years, I'm quite familiar with what a market intervention looks like. If you believe the BOJ will intervene, then there are some interesting technical setups to consider
Trading Idea: Counter-Trend Trading Opportunities on EURUSDEURUSD has an overall bearish trend. At this point, many counter-trend traders, including myself, are looking for counter-trend trading opportunities. We've had some luck in this regard.
Analysis:
Daily Chart:
- Bullish Shark Pattern: Confirmation is formed, suggesting potential for a counter-trend move.
4-Hourly Chart:
- Falling Wedge Trading Setup: Provides a setup to go long and take advantage of the bullish pattern on the daily chart.
Strategy:
- Bullish Shark Pattern: Use this co
Trading Idea: Shorting GBPJPY Amid Conflicting Signals from JapaThe recent statement from Japan's Finance Minister about possibly giving up FX intervention due to its ineffectiveness, which seems to suggest acceptance of the yen's continuous weakness, directly conflicts with recent BOJ communications.
Considering this, shorting GBPJPY becomes a highly volatile decision. Nonetheless, a trade is a trade. If this trade goes well, profits are expected within 2 hours. If not, that's part of the game.
Trade Setup:
Short GBPJPY
Entry : 202.97
Stop-Loss : 203.
Trading Idea: Classic Support and Resistance vs. Harmonic PatterSometimes, the classic Support and Resistance trade is more effective than Harmonic Patterns. It may seem simple, but trust me, it isn't. First, you have to plot it the right way, and even then, different analyses will view the trend differently.
For example, I’ve recently got into shorting USDCAD.
Key Points:
- Support and Resistance: Often more reliable than Harmonic Patterns if plotted correctly.
- Different Perspectives: Proper plotting can lead to varied interpretations of the trend.
- C
AUDCAD Analysis: Focus on Bullish Shark PatternIf you're looking at AUDCAD, the 4-hourly chart setup might seem tempting for a buying opportunity. However, I prefer the 1-hourly chart, specifically the Bullish Shark Pattern.
1-Hourly Chart:
- Key Level : Ensure an MCC appears at 0.9041 before entering a buying opportunity.
What's your trade plan for AUDCAD? Comment down below and share your thoughts!
Happy trading!
NZDJPY Trend Reversal OpportunityOn the 1-hourly chart, it looks like a regular shorting opportunity with Key Resistance Level retested at the almost perfect, but potential BOJ Intervention zone, so for traders of all kind to ''try their luck!!''
However, on the Grand Scale of things, and it is a Type2 Bearish Shark Pattern on the Daily Chart.
After I'd include the buffer, I the market hit Price Action Level at 94.00, hence, I'd to push my SL 10pips away, but making it 94.10.
Let see how the market moves before the New Yor
Bitcoin (BTC) Price Analysis: Preparing for the Bearish AbyssIn this technical forecast, we delve into the darker recesses of Bitcoin's potential price journey. We observe a concerning configuration on the BTCUSD chart where the currency is currently grappling with critical support levels.
Current Dynamics:
The price has recently retracted from a peak, teasing the possibility of a significant downtrend.
A descending channel formation can be seen, indicating a tightening bearish grip on the market momentum.
Worst Case Trajectory:
Should the pr
GBPUSD Analysis: Trend Continuation TradingTrade Strategy: Trend Continuation
- Key Level (1-hourly chart): Retest at 1.2419
- Additional Setup (4-hourly chart): Bullish Shark Pattern at 1.2141
Analysis:
- Approach: Identifies potential opportunities for trend continuation trading
- Key Level: Looks for a retest at 1.2419 on the 1-hourly chart as an entry point
- Additional Setup: Considers stretching the target to 1.2141, the completion of a Bullish Shark Pattern on the 4-hourly chart
Trade Plan:
- Entry Point (1-hourl
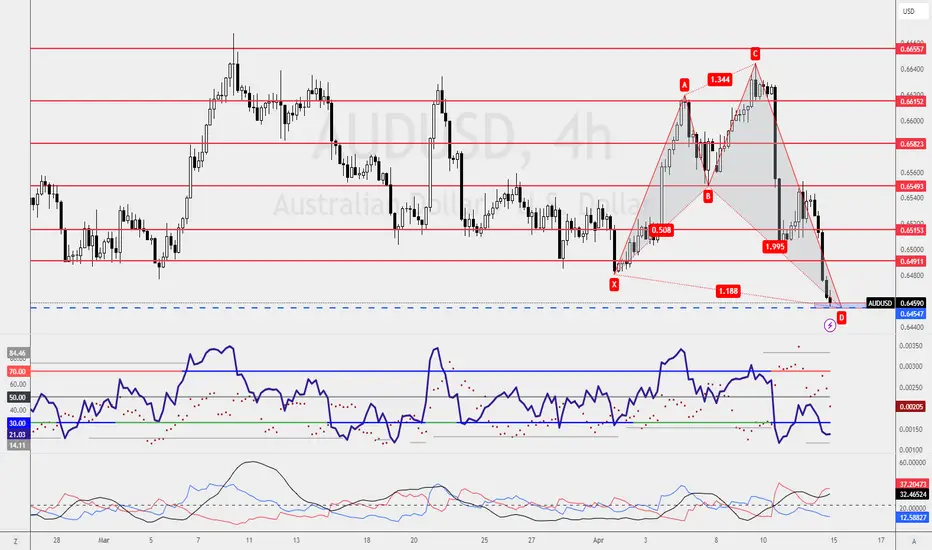
AUDUSD Analysis: Bullish Shark Pattern- Trade Strategy: Bullish Shark Pattern
- Key Level: 0.6454 (Retest Level)
- Challenge: Strong Bearish Movement
Analysis:
- Importance: Highlights the difficulty of trading a Bullish Shark Pattern amid strong bearish pressure
- Technical Analysis: Identifies a Bullish Shark Pattern on the AUDUSD chart
- Challenge: Requires a 3-bar reversal and candlestick confirmation for a viable buying opportunity
Trade Plan:
- Entry: Consider a conservative entry at the retest level of 0.6454
- Con
NZDJPY Analysis: Bullish Combo Trade SetupTrade Strategy: Combo Trade (Bullish Deep Gartley + Bullish Shark)
Key Levels:
- Bullish Deep Gartley Pattern: 4-hourly chart
- Bullish Shark Pattern: 1-hourly chart
- Trading Zone: Coincides with Bullish Shark completion
Analysis:
- Importance: Utilizes a combo trade strategy for enhanced risk management and profit potential
- Technical Analysis: Identifies a Bullish Deep Gartley Pattern on the 4-hourly chart and a Bullish Shark Pattern on the 1-hourly chart
- Trade Management: Enables a
GBPUSD Analysis: Support and Resistance Trade SetupTrade Strategy: Support and Resistance
Key Levels:
- Support at 1.2435 (1-hourly chart)
- Resistance at 1.2534 (1-hourly chart)
Analysis:
- Importance: Utilizes support and resistance levels for trading opportunities
Trade Plan:
- Buying Opportunity: Look for buy entries near support at 1.2435
- Shorting Opportunity: Consider shorting near resistance at 1.2534
Insights:
GBPUSD presents support and resistance trading opportunities on the 1-hourly chart. Traders can consider buying n