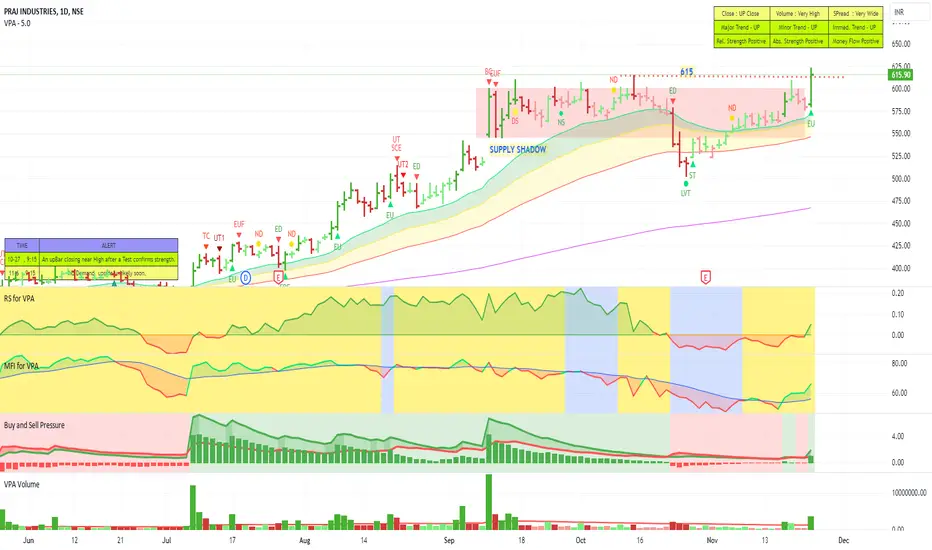
PRAJINDThe stock is coming out of the Supply Shadow of the "BC" bar. The Relative strength is turning positive. Buying Pressure and Money flow are already positive. Another upbar closing above the shadow preferably above today's High will ensure that the stock will move much higher.
Also on the weekly as well the stock is moving above the supply shadow of a BC bar. All key parameters remaining positive.
Bullish Bat
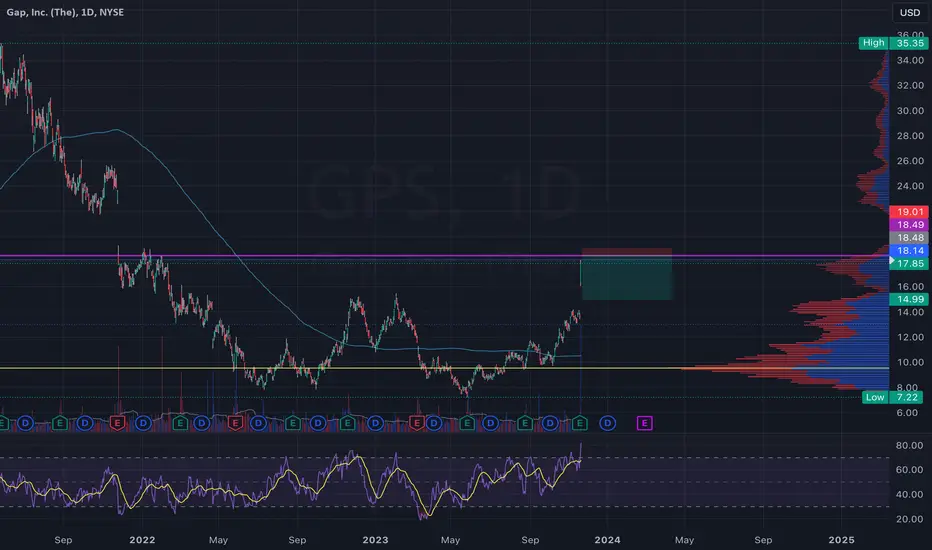
GAP Short under 18.50Retracement play for XETR:GAP after major earnings pop. Beware this still has momentum , but we are reaching an overvalued territory.
Big volume gap also seen above 19 , which is unlikely to fill with this overextended trend.
Price target - $15
GShort
Dive into GBPUSD Trading InsightsGBPUSD currently exhibits a Weaker Bullish Trend on the weekly chart, introducing interesting dynamics.
On the 1-hourly chart, a bearish shark pattern emerges, presenting a counter-trend trading setup. Simultaneously, the 4-hourly chart showcases a bullish bat pattern within the buy zone.
My preference in this scenario is clearโI favor the bullish bat pattern on the 4-hourly chart.
Now, I'm curious about your preference. What's your take on these setups? Feel free to share your insights below
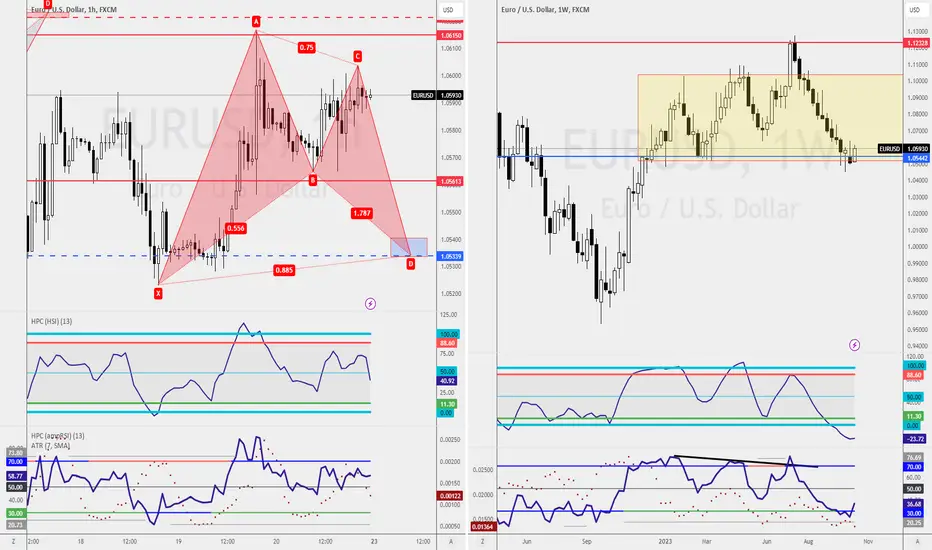
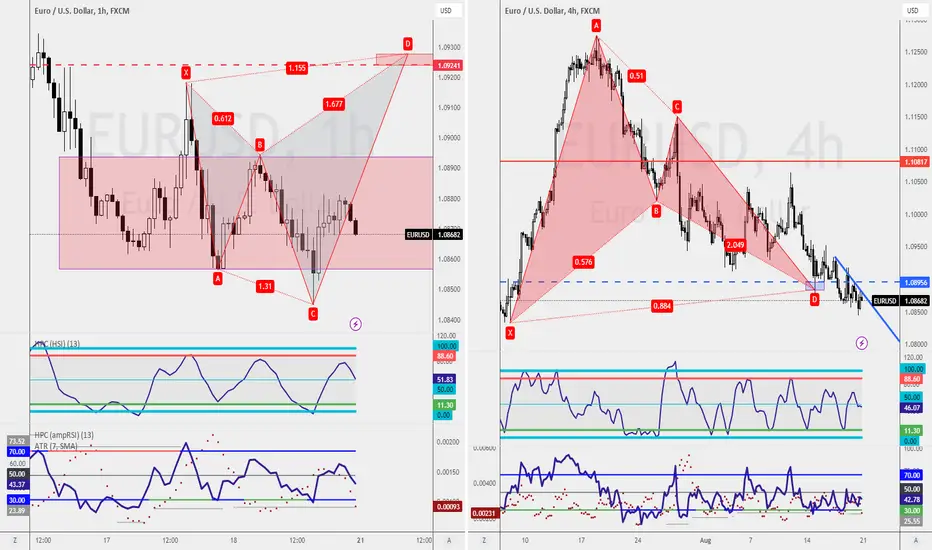
Money Making Opportunities in EURUSDEURUSD is currently navigating a weaker bullish trend on the weekly chart, adding an interesting layer to the market dynamics.
On the daily chart, a bearish flag pattern setup unfolds, creating an intriguing scenario. Furthermore, the 1-hourly chart reveals a bullish bat pattern, while the 4-hourly chart showcases a bearish bat pattern.
In the week ahead, I'm poised to engage in whichever trading setup comes to fruition first.
Now, I'm keen to hear about your trade plan. Do you carry any tren
Unlocking Trend Reversals: Mastering Bollinger Bands and VWAPsIn this comprehensive video tutorial, we will delve into the powerful techniques of utilizing Bollinger Bands and VWAPs (Volume Weighted Average Prices) to identify and master trend reversals in the futures market. ES1!
You will learn how to leverage these volatility-based indicators to detect potential turning points in price trends. By understanding Bollinger Bands' ability to highlight periods of market consolidation and expansion, you will gain an edge in predicting trend shifts and take ad
Capitalizing on the Bearish Trend
The entirety of the NZDUSD landscape is signalling a potential shorting opportunity.
Technical Insights:
The volatility trendline, once a counter-trend reference, has been breached and closed below. Now, we await a retest of this trendline as an entry point for a shorting opportunity.
Extended Target:
For those inclined, extending the target to the completion of the Bullish Bat Pattern on the Weekly Chart at 0.5626 could be a strategic move.
Always employ your own risk m
Bullish Trend Perspective
Weekly analysis indicates a sustained bullish trend for EURUSD.
Trading Strategy:
Monitoring the 1-hourly chart for a potential Bullish Bat Pattern with an entry point at 1.0533.
Cautionary Note:
It's crucial to observe that point C touches point A in the formation of the Bat Pattern. This warrants caution and prevents me from placing a pending order to engage the trade.
Remember to conduct your own due diligence and manage risks appropriately. Happy Trading!
Strong Bullish Trend for High Returns!The USDJPY is currently experiencing an upward trend. To capitalize on this trend, I plan to wait for a chance to buy at the Fib-3 Bat Pattern completion on the 1-hourly chart at 149.09.
However, it's important to note that both the 4-hour and daily charts show a Bearish Harmonic Pattern that completes at a similar level of 150.41. As such, it would be best to wait for a candlestick pattern completion before considering a counter-trend trade.
๐๐ Exciting NASDAQ Buying Opportunity! ๐๐Fellow traders, listen up! We've got a promising setup on the 4-hour timeframe for NASDAQ that's worth your attention:
๐ Technical Analysis Highlights ๐
๐ฐ Reversal Strategy: After securing nearly 1000 points with short positions, it's time for a strategic shift towards buying opportunities.
๐ฆ Bullish Bat Pattern: The price action has completed the D leg of a bullish bat pattern, signaling the potential for a bullish reversal.
๐ RSI Confirmation: The RSI is in highly oversold territory, provid
A Great Trading OpportunityAs per my analysis, a Fib-3 Bat Pattern is about to complete at 1.8979 on the Daily Chart. To minimize the initial risk, I will wait for a buying opportunity on the H4 or H1 chart. This will significantly reduce the stop-loss to 1.8733 (-246pips) or close to -2,460usd/lot, while the first target will be at 1.9363 (+384pips) or close to 3,840usd/lot.
I believe that a good trader follows a good mentor, but a great trader plans his own trade and takes reference from others' analysis. Therefore, I
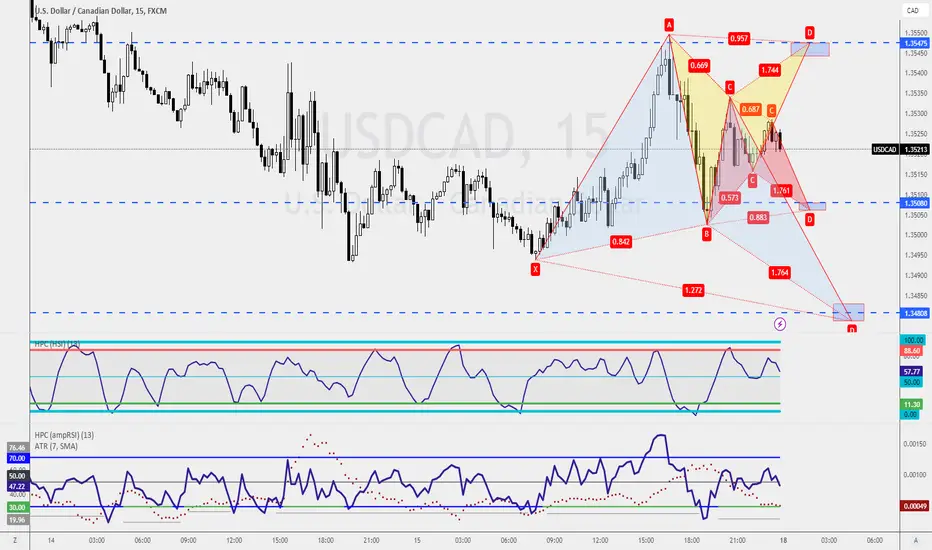
Opportunities Abound!The Dollar Canada pair offers a chance to capitalize on a bit of consolidation after an uptrend movement. Upon examining the daily chart, there appears to be a retest of the previous resistance, indicating a favorable buying opportunity for counter-trend traders.
The 4-hour chart shows a retest of the support area, which could potentially lead to a harmonic pattern on the intraday time frame, such as the 15-minute or 1-hour chart.
On the weekly chart, the Dollar Canada has a fib-3 bat pattern
LTCUSD: Ascending Broadening Wedge with a Confirmed Partial RiseWe have confirmed the partial rise of the Ascending Broadening Wedge and have failed to break above the major support/resistance level. I now expect the price of LTC to go even lower than 40 and perhaps to around $25-$19 as that would be the HOP level of the Bullish Bat it is currently BAMMing from, but it is possible we get a reaction at around $35 as that would be the 88.6% Retrace, but the most confluence is at the $25-$19 area.
US Dollar Still Bullish๐ Weekly Chart: Bearish bat pattern suggests shorting at 149.33.
๐ Daily Chart: Bullish movement, no shorting opportunity.
๐ Four Hour Chart: ABCD pattern at 147.76, potential shorting level.
๐ One Hour Chart: Bullish bat pattern with running profits.
๐ Weekly Chart Insight:
- Bearish bat pattern for potential shorting.
- Waiting for confirmation at higher levels.
๐ Daily Chart:
- Bearish crab pattern at 150.41.
- Focus on 144.79 for buying opportunity.
๐ก Trading Opportunities:
- Potential sh
Market Stands Firm on Support!๐ Weekly Chart: Long shadow at support, prior resistance.
๐ Daily Chart: ABCD pattern, respecting support.
๐ Four Hour Chart: Counter-trend trade possibility.
โณ One Hour Chart: Bullish bat pattern, wait for confirmation.
๐ Weekly Chart Insight:
- Market stands still in buy zone.
- Different from Eurodollar.
๐ Daily Chart:
- ABCD pattern, support respected.
- Previous trade resulted in 219 pips gain.
๐ก Trading Opportunities:
- Confirmation of support for a buy.
- Counter-trend trade in the sel
Trading Opp. Amid Sideways WavesTrading can be exhilarating when setups let you seize chances without wrestling with the broader trend. ๐
Let's talk New Zealand Yen โ a treasure trove of potential this week, regardless of the overarching movement.
Gaze upon the weekly chart, and you'll spot the bearish shark pattern, already in motion since 88.24. Kudos if you've joined the ride! I'd ride it to the first target at 84.36, where the 5-0 pattern gifts a buying prospect. Our watchword: Will the market cradle within the blue box
Strong Bullish WaveEyes on the pound dollar chart reveal a resolute bullish trend. If contemplating a shorting opportunity, meticulous strategy testing and conservative stop-loss management are paramount. ๐๐ผ
Turning to the weekly chart, a pullback effortlessly rests on prior resistance, indicating the enduring strength of the overarching bullish trend. Daily chart support stands steadfast, with potential traders wary of a head and shoulder formation at 1.2831. However, personal experience dismisses this due to th
Riding the Bullish WaveAmidst the whirlwind of events, the Euro-Dollar chart stands strong with a bullish trajectory. ๐ The weekly chart showcases a series of resolute highs, fortified by untested supports, painting an appealing canvas for potential buying opportunities. ๐จ
Zooming into the daily chart, a pivotal support at 1.0834 shelters the bullish sentiment. A breach here could cast shadows on the prevailing optimism. However, the four-hour and one-hour charts echo a touch of bearish undertones, contrasting with t
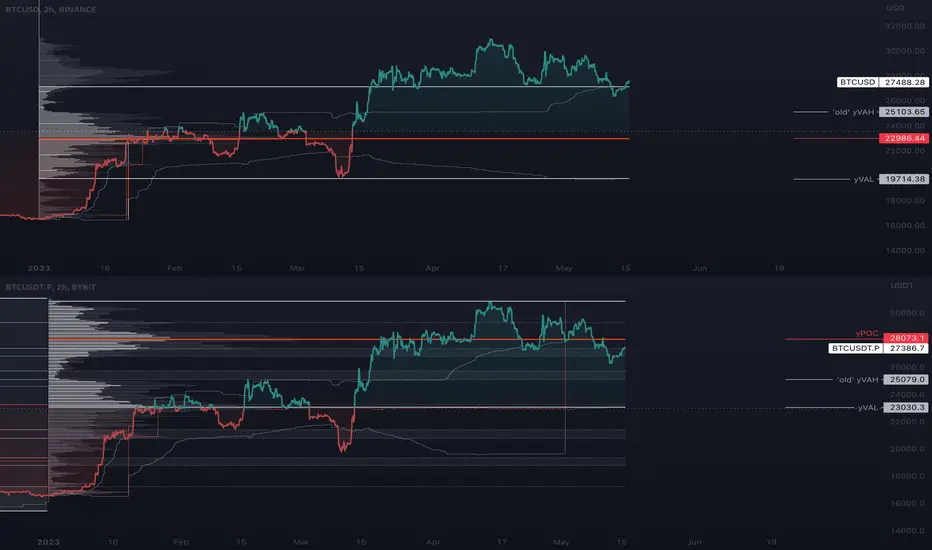
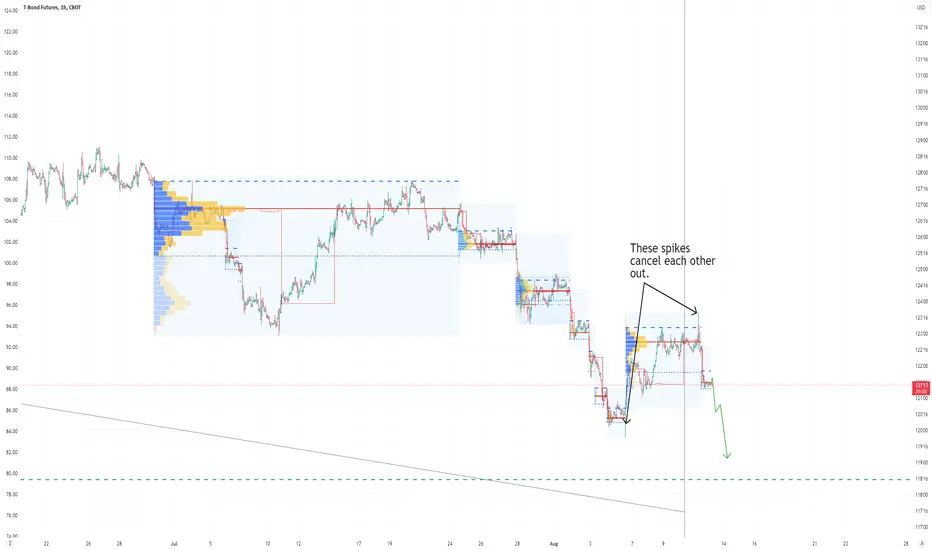
Was that it for the rally in US bond prices?Using Volume profile to isolate periods where the market completes a cycle (going from balance to imbalance) , recent price action suggests the end of the correction to the downtrend in bond prices. The spikes lower and higher bookend the period of treading water. Sell rallies above 121.15 looking for sub 120 (stop 122.16)
VARUN BEVERAGES - A Stock to WatchThe stock retreated after facing supply. After some consolidation the stock is again negotiating the previous supply area. Volume support is also coming in. Delivery volume also increased indicating interested longer term buyers. Relative strength, Money Flow and absolute strength all in the green. A good close above 873 with volume support will put the stock back in upward trajectory. However the overall Market which is seeing some weakness may play spoil sport. Still a stock watch.