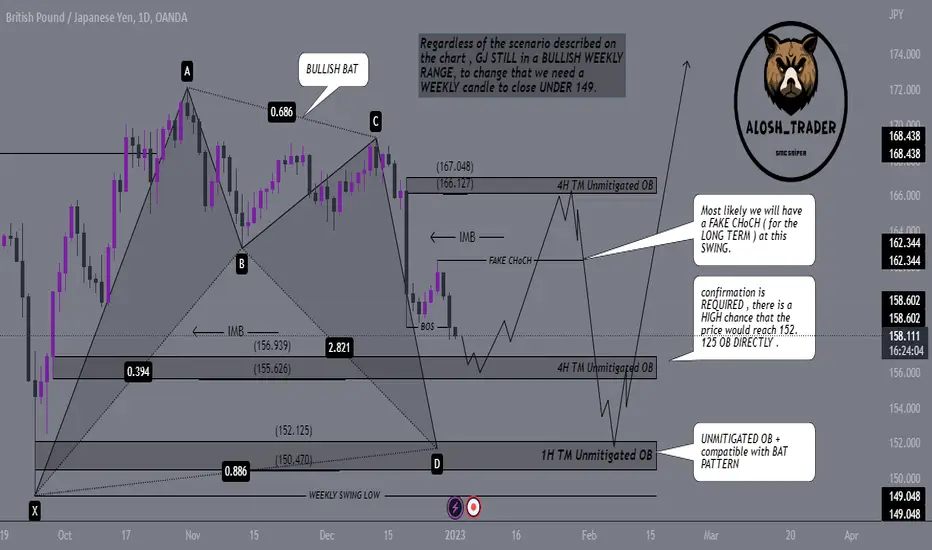
Bullish Bat
My Ultimate Trade for the WeekMy Ultimate Trade for the Week falls into the hands of the Head and Shoulders Pattern on the daily chart(right).
The Bullish Bat Pattern(left) is the perfect setup for me to achieve Low Risk, High Returns trade; however, it is unlikely to happen as the Bat Pattern must be completed by Monday, 20 Feb, 7 am or 12 pm(SGT).
The next sensible setup would be the potential Bullish Flag Pattern that goes into an over-extension period.
A Big Fat Trading IdeaBased on the Daily Chart Analysis, GBPUSD is on a Bullish Trend. On the current timeframe, I'm waiting for a Buying Opportunity of the Bullish Bat Pattern trading setup, and the potential entry price I'm looking at is 1.1988.
This has great potential for me to upsize my target level if you know where to look.
TH | Bullish Bat Harmonic | Breakout Signal Entry Position TH | Thailand SET Index | Financial Sector | Price Action & Chart Pattern Trading
Chart Pattern: Falling Channel - Bullish Bat Harmonic Pattern
Price Action: Breakout Entry Position
Indicator:
> RSI Bullish signal crossing up MA line above 50.
> MACD Bullish - golden cross signal just below the baseline.
Trade with affordable risk ratio 3:1
Trust in your system indicator
Never panic trade
Always respect stop-loss
Goodluck
DP
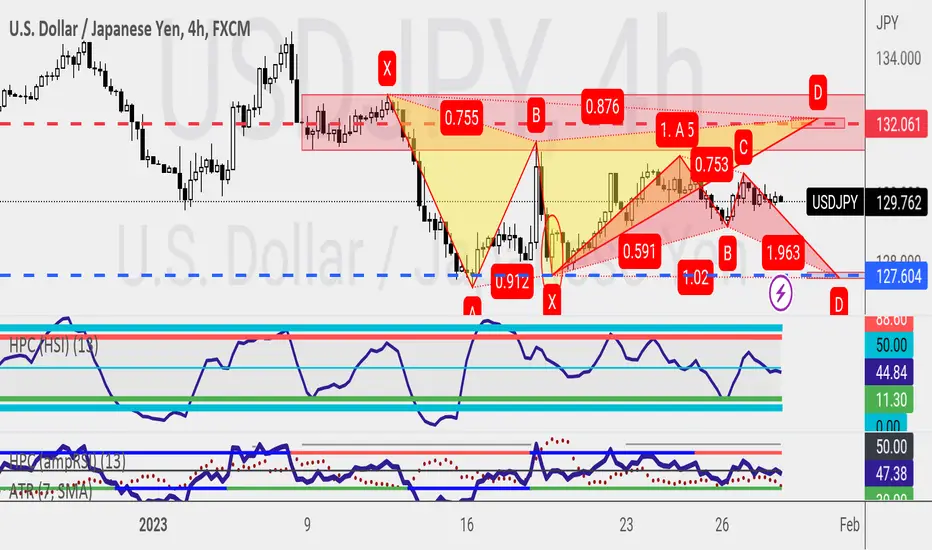
USDJPY-Weekly Market Analysis-Feb23,Wk1My analysis for this year Mid 2023 still remains Bullish for US Dollar. So it's pretty normal for me to look for buying opportunity on USDJPY. If you are looking for shorting opportunity, the Bearish Gartley Pattern will expire by 31Jan2023, 6pm (GMT +8). This is not guess work but advance trading techniques that serious traders should know.
The first harmonic patterns that form up and gives me a confirmation signal, I will engage the trade. Obviously I'm incline to long the Bullish Bat Pattern.
Ericsson: Bullish Bat with MACD Bullish DivergenceWe have a Bullish Bat Visible on the Weekly and Monthly with Weekly MACD Bullish Divergence near the bottom of a Decades Long Range. If we bounce from here to the range top a Partial-Decline will be Confirmed that could likely result in a Breakout to $28.
Ericsson also has a great P/E Ratio to back it up and as a result i have gotten the Jan 19 (413d) 8 C call options that are currently trading at well below a dollar.
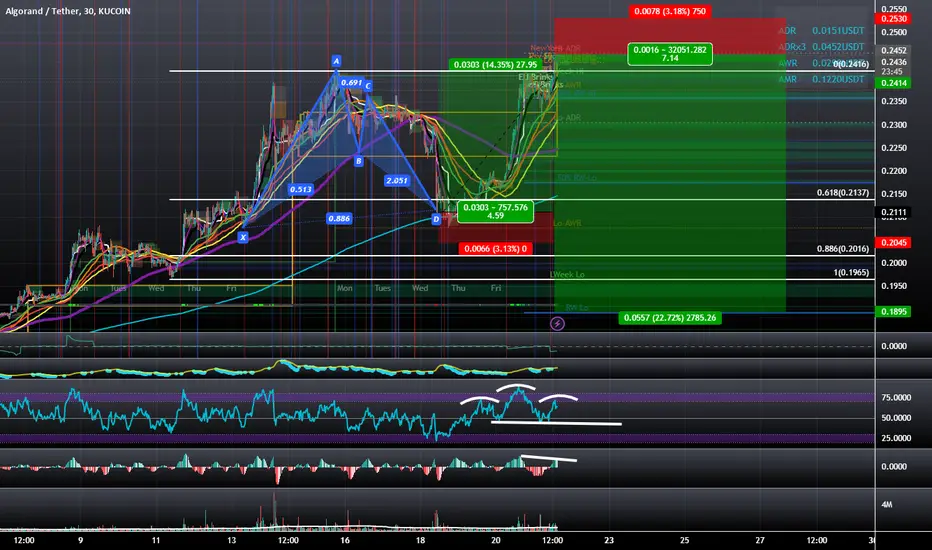
Algorand: Potential Bullish Bat at 61.8% RetraceAlgorand has just hit the lows pretty hard and is now trading at the Lo-AWR and looks to be exiting the local consolidation trend at the lows soon. At the sametime we have a SMall Local Bullish Bat whos PCZ lands at the 61.8% retrace from the swing low to swing high. This particular Bat here is not the most grounded bat but i think it's worth considering and will be targeting the highend of the range.
GBPUSD-Weekly Market Analysis-Jan22,Wk3GBPUSD is on a bullish trend; a Bullish Bat Pattern completes at 1.2101 and gives us a candlestick pattern confirmation within the Bat Pattern, within the Demand Zone / Buy Zone. Note that Point C poses a warning sign for the Bat Pattern traders; a candlestick pattern confirmation is a MUST for me.
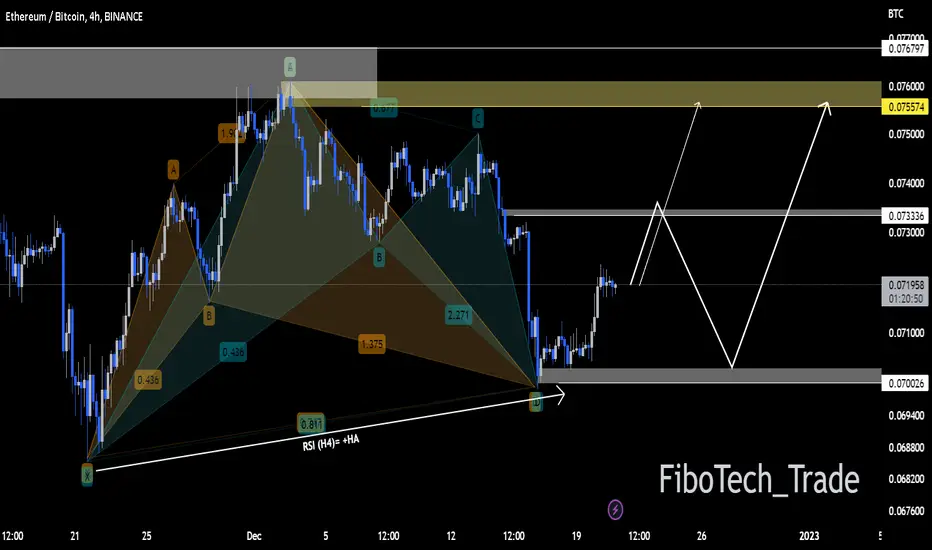
ETHBTCHello dear friends
In the four-hour time frame, positive RSI divergence is associated with butterfly and bat harmonic patterns.
Considering that the support range of $0.06552 has been maintained in the previous correction process, the possibility of seeing the lower areas is currently weak.
As long as the range of $0.070026 is maintained, we expect the formation of an increasing trend similar to the drawn scenario.
We would be happy to hear your comments
AARTI INDUSTRIESHello and welcome to this analysis
Stock has made a Bullish Harmonic Bat reversal suggesting a bounce back to 675 and 745 as long as it sustains above 590 (hourly basis)
Smallish resistance near 615 and above that at 645
Good risk reward set up at the current juncture
Happy Investing
SPY Update: Bullish Trade Idea Still AliveDespite being tempted to exit this trade during the extended hours activity but i'm now seeing a bullish variables during the regular session such as a Bearish 3 Line Strike at the 88.6% retrace and it's coming off of oversold conditions on the RSI so im adding to my UVXY and TZA puts and shorts and staying long the SPY.
WTI USOil Setting for Short Trade?FX:USOILSPOT
TRADE PLAN
INSTRUMENT: USOil
TIMEFRAME: DAILY
DESCRIPTION
Although fundamental drive illustrates that OPEC+ will cut oil production by 2mil barrel a day going forward, our Technical Outlook suggests that USOil Price will continue to fall untill we arrive at 70.00. The current rally appears a sentiment drive.
We will look to short the market when price visit a 55EMA with some confirmation to short for completion of Daily Bat Pattern.
Updates to follow.
Disclaimer
Charts are educational not investment recommendations