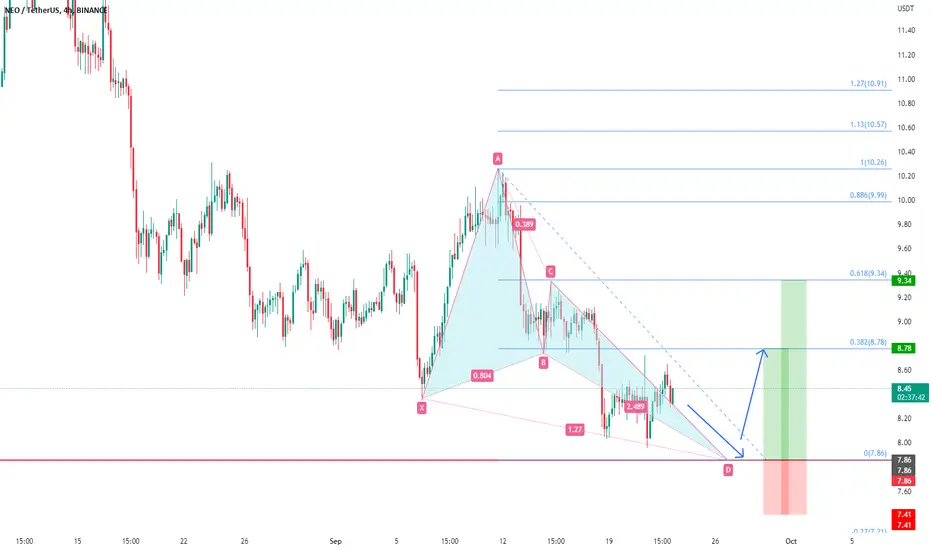
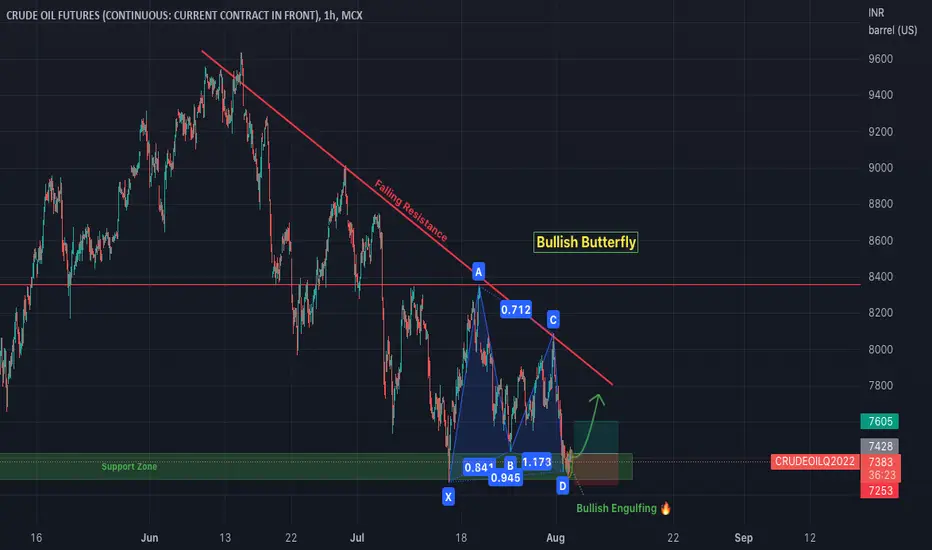
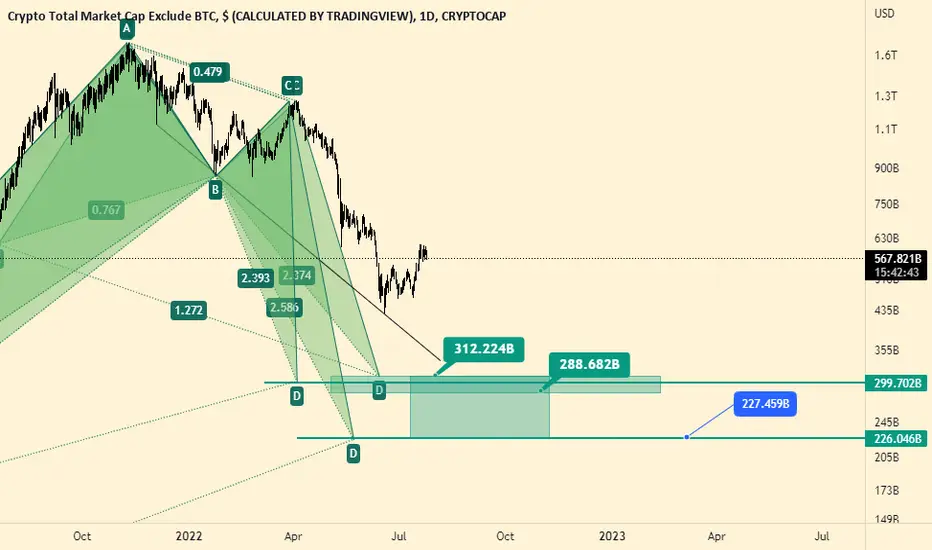
AUDUSD - Bullish ButterflyA potential Bullish Butterfly may form up at 0.6340, NO. By looking at the current candlestick pattern formation, it is more likely for the market to react from the current price of 0.6368.
To most Harmonic Patterns traders is a big No-No for them, but sometimes we have to execute flexibility. With that said, I will look closely at the market movement from 8-10am( GMT +8).
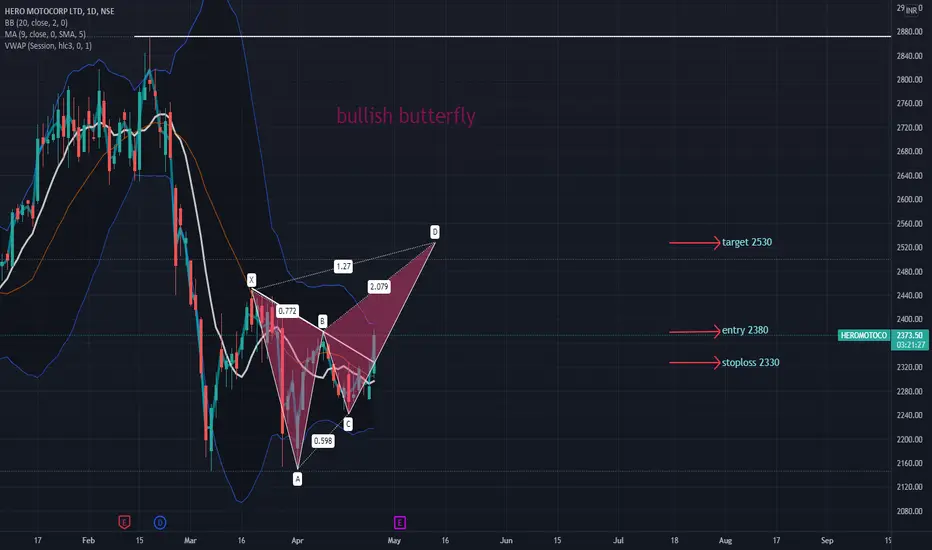
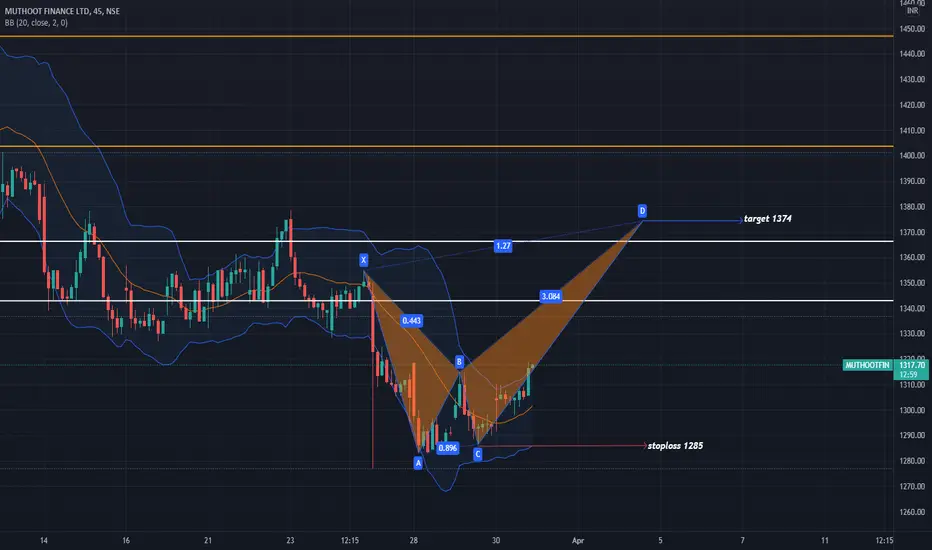
Bullish Butterfly
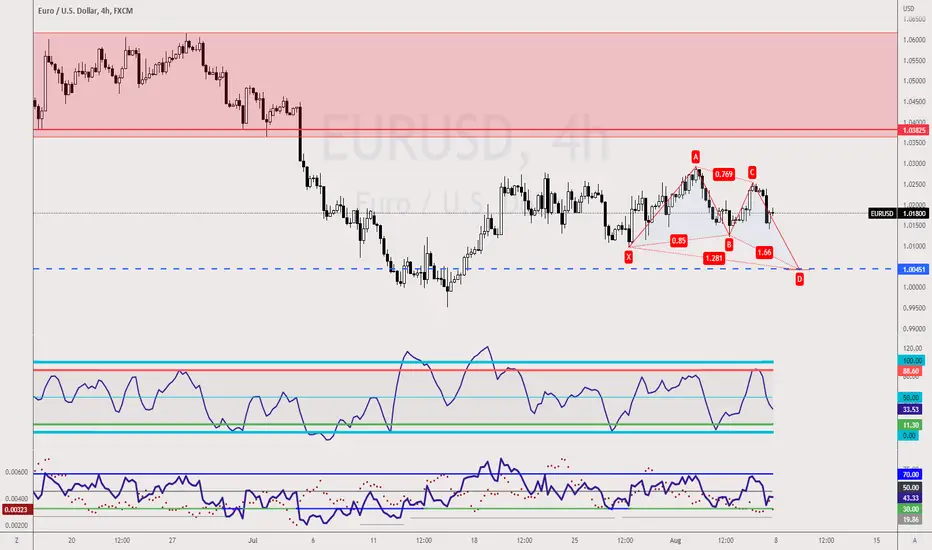
EURUSD-Weekly Market Analysis-Aug22,Wk2A Bullish Butterfly form at 1.0045 could be an opportunity for counter-trend traders to wait for a counter-trend trading opportunity that completes at that price. However confident you are in the trading setup, it is important to wait for candlestick confirmation before engaging in the trade.
CAD/CHF: Bullish butterfly harmonic patternI found out that Canadian Dollar/Swiss Franc forming a bullish butterfly harmonic pattern with the correct measure using Fibonacci for harmonic. But I see that CAD/CHF as forming this bullish perspective. I believe that CAD/CHF will continue drop, yes drop but doesn't drop as I expect because we see a wick of manipulation zone that institutional are interesting to buy this forex par.
I show clearly the rejection point, and also in H1 you can to see better as in H4 timeframe, because the drop
AUDUSD - Bullish Butterfly Pattern A potential Bullish Butterfly Pattern might just catch the falling knife. I'll be waiting for the candlestick touch the furthest line of the rectangle at Point D and show me a confirmation sign to engage the trade.
Retest on Point D will not be the requirement for this trade.
DOGE/USD Inverted Head and Shoulders at PCZ of Bullish ButterflyWe are at a PCZ of a Bullish Butterfly printing a Potential Right Shoulder of an Inverted Head and Shoulders Pattern Visible on the Weekly with a bit of Bullish Divergence to top it off.
My Stop loss will be below 10 cents and my TP will be above 30 cents.
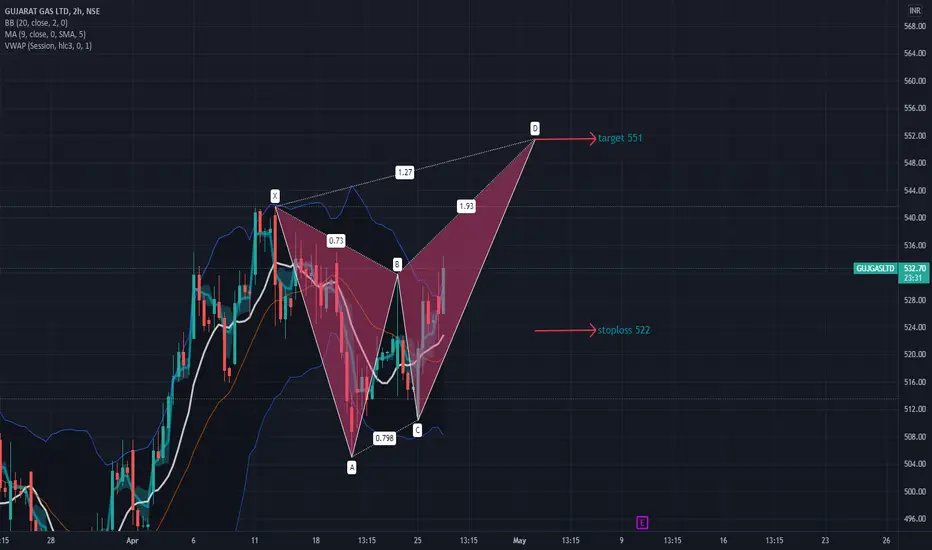
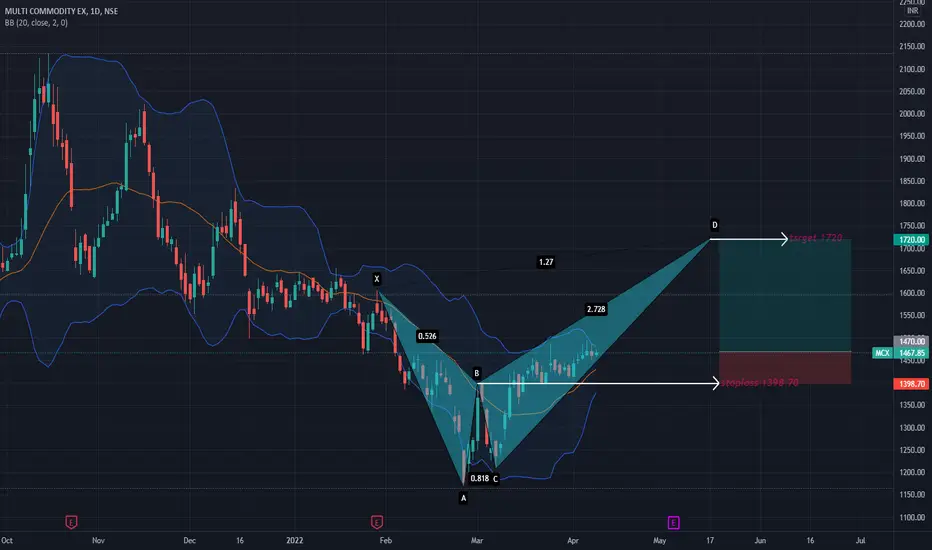
GUJGASLTDGujgas made bullish butterfly pattern on an hourly charts with very good above average volumes & with increase in OI.
Could be bought with mentioned stoploss & targets.
GLong
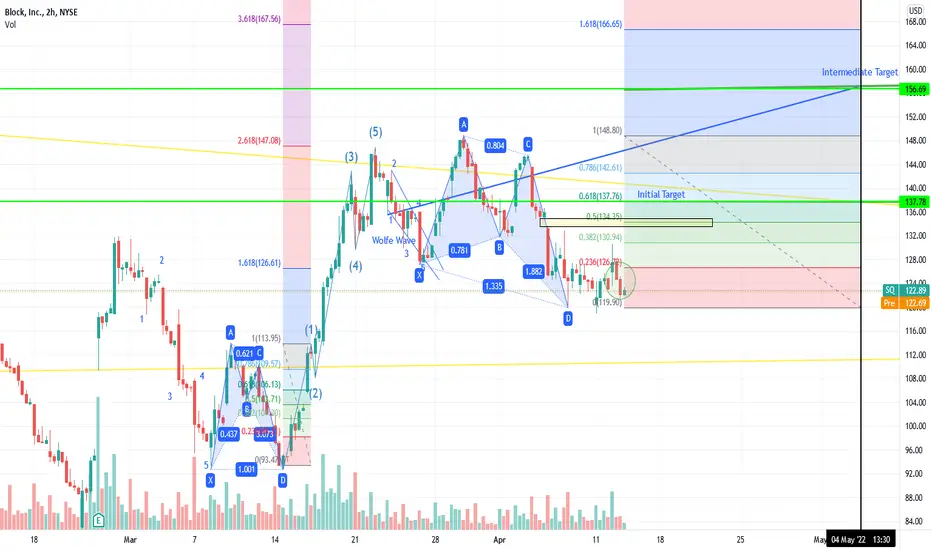
An Intricate BlockA lot of bullishness unfolding here so I will start with the targets and break it down how I got them and why I am so bullish on SQ.
*Initial Target = 138 ; time to target TBD, what I'm looking for is 3 consequtive green candles at the 2 hour level (estimating time to target occurring before the end of April)
**Intermediate Target = 157 by 5/4/2022 - I will explain below
Goal Target is above 166 , but will return to this after the first 2 pts are hit (I can say time to target is after May 4
On the Wings of a ButterflyNear term Bitcoin likely to get some wings - Bullish Butterfly with initial target around 41k. Description of chart below:
- yellow zone would complete butterfly harmonic, expect liftoff from there
- green zone is initial 1.618 target range
- red horizontal line is 3 standard dev. under the displacement of the proportional differences between 9 day s.m.a and price vs. 9 day s.m.a and 20 day s.m.a which is acting as a local over-extension to the down side relative to recent peak around 48k
- do
BTC/USD: Bullish butterflyBitcoin forming a bullish butterfly harmonic pattern and we see that it's a bullish pattern, and also to take in note we forming a bullish divergence in the RSI forming a lower high in RSI and price action lower low. That it's an indication that the trend will going return bullish.
So guys, in H4 it's look bullish.
Are you agreewith this analysis?
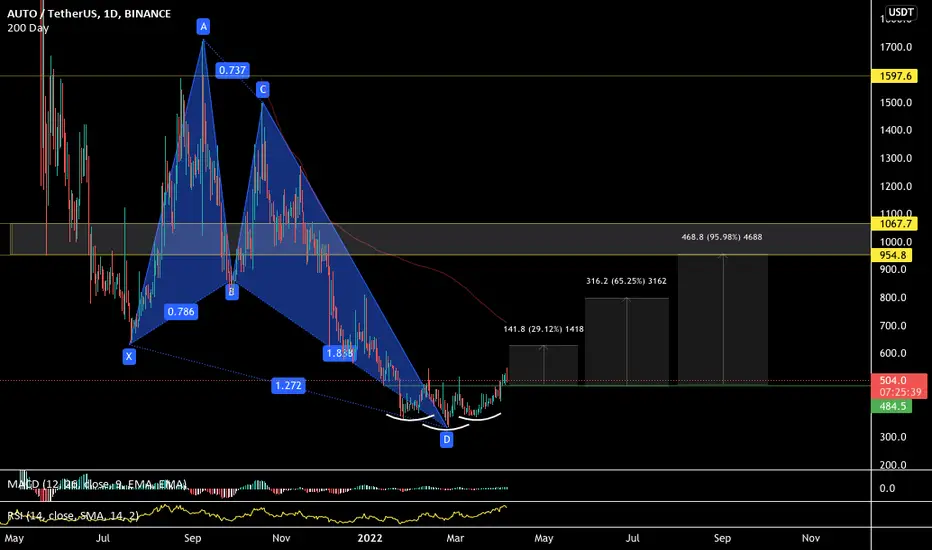
AUTO/USDAlthough i hate how much of an under performer this asset has been and that it has only ever made lower highs and lower lows
Here you can see momentum is shifting after a textbook Bullish Butterly Harmonic PCZ at the 1.272 fib extension an Inverse Head and Shoulders pattern has matured.
Not something that i would personally long just because of the sheer underperformance of this asset overall but you cant say momentum isnt shifting here and the bottom could be in!
3 targets if you wanted to go
ALong