🚀 AUD/USD Bullish Breakout: Long Opportunity 📈The AUD/USD pair looks bullish 📈, as it has broken above the 200-day SMA. We're taking a long position at 0.67922, targeting 0.68498 (TP) with a stop loss at 0.6734 (SL). Keep an eye on the upcoming RBA decision, which could impact the market sentiment. Trade with caution and manage your risk wisely. Good luck! 🍀
Signal provided by @ss7trader 🌟
#AUDUSD #forex #trading #long #bullish #RBA #technicalanalysis #ss7trader #tradingview
Bullish Gartley
HOOKUSD: Sits at PCZ of a Bullish GartleyThe MACD is prepped for a Bullish Crossing as it attempts to show its first confirmation of Bullish Convergence since hitting the PCZ the first time. If it can bounce here again it would be a Higher Low and Break Hook and Go off the Gartley PCZ which from there I think will have room to more than double in value.
HLong
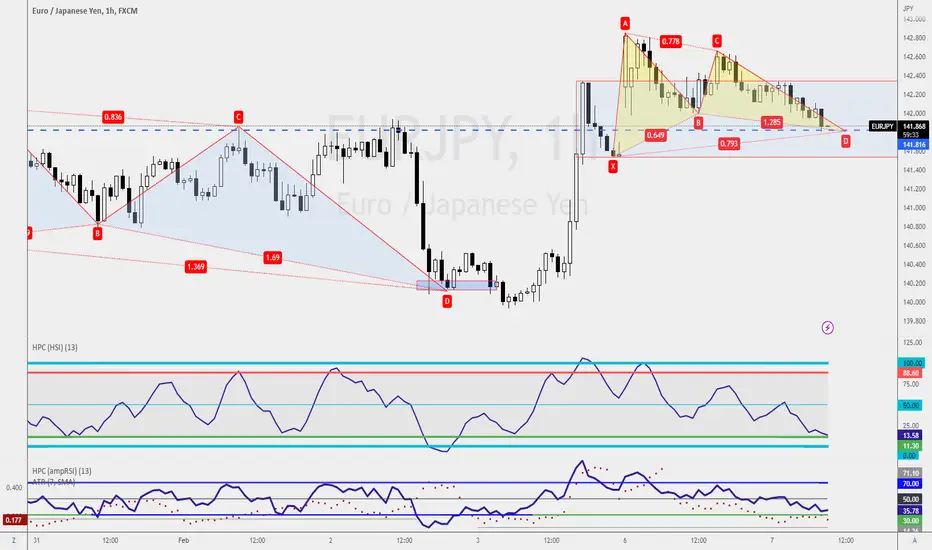
368pips x2 profit potentialIt depends if you are looking for a buying or selling opportunity on the EURJPY. Traders who are looking for shorting opportunities could wait for a Bearish Shark Pattern retest at 145.31.
If you are looking for a buying opportunity, the Bullish Gartley Pattern on the Trendline that completes at around 141.63for a buying.
If you have no issues trading both ends, you wait for the confirmation to happen before engaging the trade that will bring 368pips of potential profits trading on both sides.
Bitcoin has been really annoying, but I will just keep this hereI do not have to provide much details here, I will just keep this here as it is visually self-explanatory.
I know, I know .. You want to me to make a comment on my last idea, well .. ok, ... but wait. You know what, .. wait. There is time for everything.
Have a great day!
TWTUSD: Logscale Bullish Deep Gartley PCZ at Channel Demand LineTWT is currently trading at the PCZ of a Logscale Bullish Deep Gartley which also happens to align with the Demand Line of the Equidistant Channel while showing MACD Hidden Bullish Divergence. I think we could see it push up to the Heartline of the Channel from here but if it gets really crazy maybe it will even push all the way up towards the top of the channel.
Standard Lithium: Double Bottom at the PCZ of a Bullish GartleyStandard Lithium is Double Bottoming at the PCZ of a Bullish Gartley which also stands near the 200 Week SMA and is Bullishly Diverging on the MACD; If it can hold the PCZ and rally back above the 200 Week SMA, I think we will begin a big move up similar to $NLST.
$GME: Perfect Bullish Deep Gartley on the DailyGME may be setting up for a rally towards the $20 area as It's recently broken out of a long term up trending channel but has formed this nice looking Bullish Deep Gartley that could send it up to atleasat backtest the channel or the moving averages as resistance.
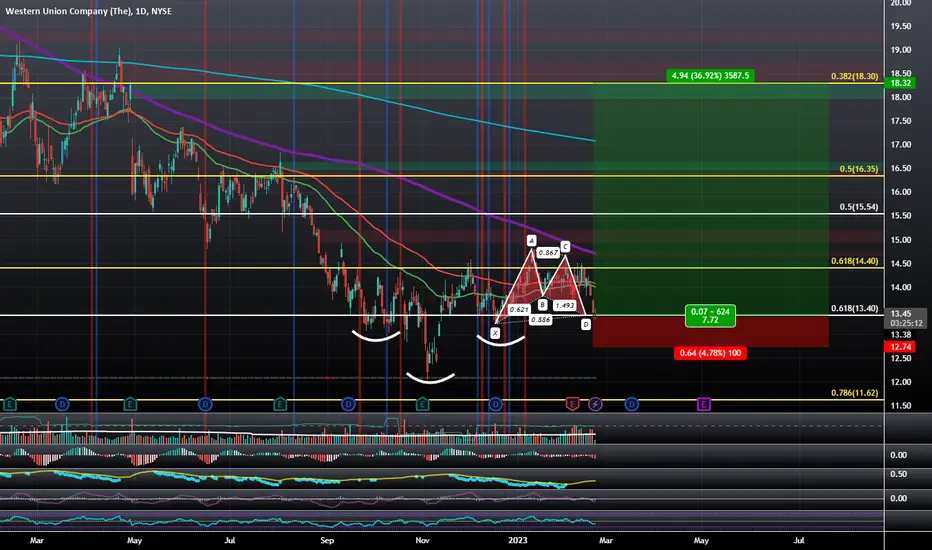
S&P 500: Bullish Gartley Above Demand LineThe Hourly setups have been stopped out and the SPX has gone significantly deeper but now looking at the Daily Setup and it gives reason to think it can continue up from here. We are at the Demand line of the Descending Broadening Wedge and are trading at what could be a Bullish Gartley. From this point I'd put stops below the 800 Day EMA and enter bullish positions at the current level and see how it goes over the coming weeks to see if we can get a Break Hook and Go.
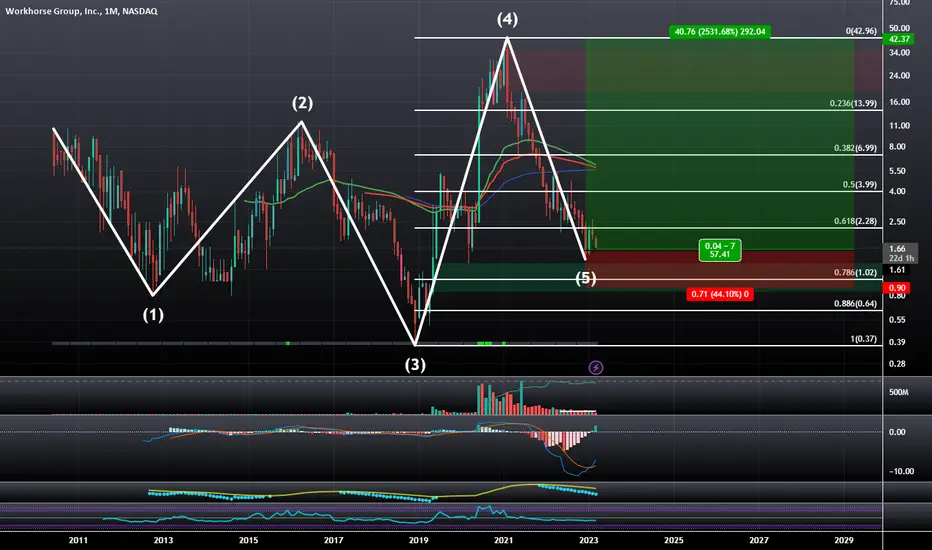
WKHS: Bullish 5-0 on the Monthly with MACD Bullish CrossoverWKHS is at the PCZ of a Bullish Gartley on the Daily timeframe.
It's also at the PCZ of a much greater Potential Bullish 5-0 and Reciprocal AB=CD all while Bullishly Crossing Over on the MACD.
If things go as one would expect a 5-0 to go we will see WKHS try to target the $42 Area in an effort to atleast make a 100% Retrace.
$ABEV: Bullish Gartley Visible on Higher TimeframesAmbev after bouncing from the PCZ of a Bullish Gartley has held and consolidated marginally above the PCZ and while doing so has shown signs that it could continue up higher from here without a secondary retest of the 0.786 as it has Recently Broken out of a Bullish Dragon and Bounced from a smaller Bullish Shark on the Daily as well as holding the POC of the overall Harmonic Range. It has also Bullishly Broken out of a Bull Flag pattern on its ARS pairing. It could always still come back for a secondary test of the 786 retrace anyway, but due to the reasons above; I think there is a high probability that ABEV will not be going any lower than it has over the last few months and that much higher prices are in play.
BTCUSDT - Possible Bullish Gartley Harmonic12 Hour Time Frame UTC+1
Fib pulled from X to A with confluence on 0.618 and nPoc (s) at 22,500 to 22,650 for first impulse move. Looking at a retest at these values. Should this retest fail, that would probably invalidate the pattern.
Should the pattern continue to play out, will be looking at resistance drawn from Fib pulled from A to B, 0.618 resistance or 0.888 typical Gartley Fib.
Should the pattern continue to play out, will be looking at a retracement back to daily at 0.782 between X and D impulse. Will be looking for a bounce at 0.382 (or 0.5 not on chart) for momentum to the upside as well to the upside.
XRPUSDT is inside a massive descending channelXRPUSDT has been creating a daily channel, indicating a period of consolidation and uncertainty in the market. However, after a bullish impulse, the market bounced off the 0.618 Fibonacci level, which is a common level of retracement in technical analysis.
This retracement suggests that buyers are still interested in entering the market and that there is strong support at this level. Furthermore, if the market is able to grab new liquidity from the 0.37$ area and break out of the descending channel, it would signal a potential shift in market sentiment from bearish to bullish.
If the market were to satisfy Plancton's Rules, which is a trading strategy that involves taking a long position when a market experiences a significant price increase, it could indicate that the market is gaining momentum and that there is strong bullish pressure in the market.
–––––
Follow the Shrimp 🦐
Keep in mind.
🟣 Purple structure -> Monthly structure.
🔴 Red structure -> Weekly structure.
🔵 Blue structure -> Daily structure.
🟡 Yellow structure -> 4h structure.
⚫️ Black structure -> <= 1h structure.
Follow the Shrimp 🦐
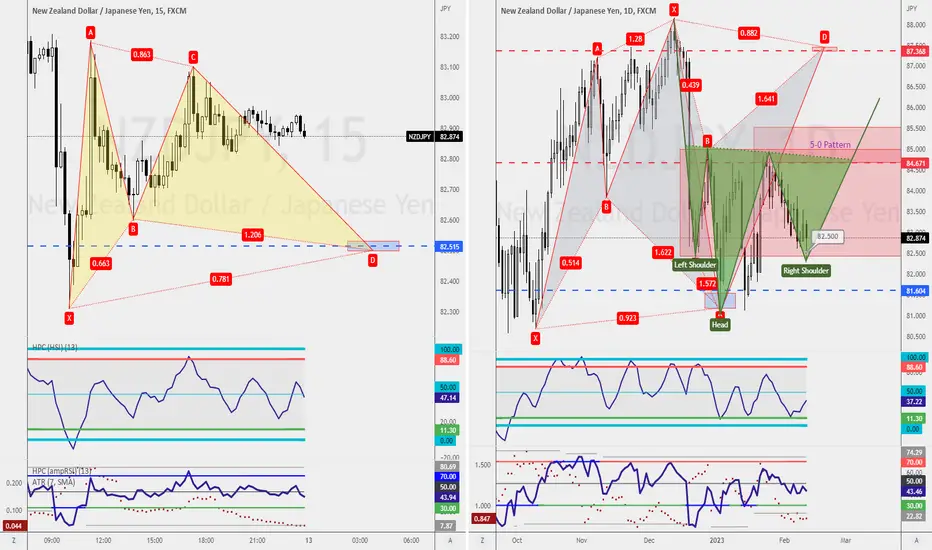
My Ultimate Trade for the WeekMy Ultimate Trade for the Week falls into the hands of the Head and Shoulders Pattern on the daily chart(right).
The Bullish Bat Pattern(left) is the perfect setup for me to achieve Low Risk, High Returns trade; however, it is unlikely to happen as the Bat Pattern must be completed by Monday, 20 Feb, 7 am or 12 pm(SGT).
The next sensible setup would be the potential Bullish Flag Pattern that goes into an over-extension period.
Low Risk and High Return TradesOn the right(Daily Chart) is the main highlight of the week. Having the Double-Headed Head and Shoulders trading setup that fulfils my trading filters for Head and Shoulders.
That being said to engage a trade-off, the Daily Chart is something I seldom do.
I'm looking for a buying opportunity of a lower timeframe, such as the Bullish Gartley Pattern on the intra-day timeframe, the 15-minute chart to engage this trade and extend my target, known as my in-house combo trade, trading management.
In this instance, I will have a much lower-risk and insane high-profit potential and the profit factor will be off the chart.