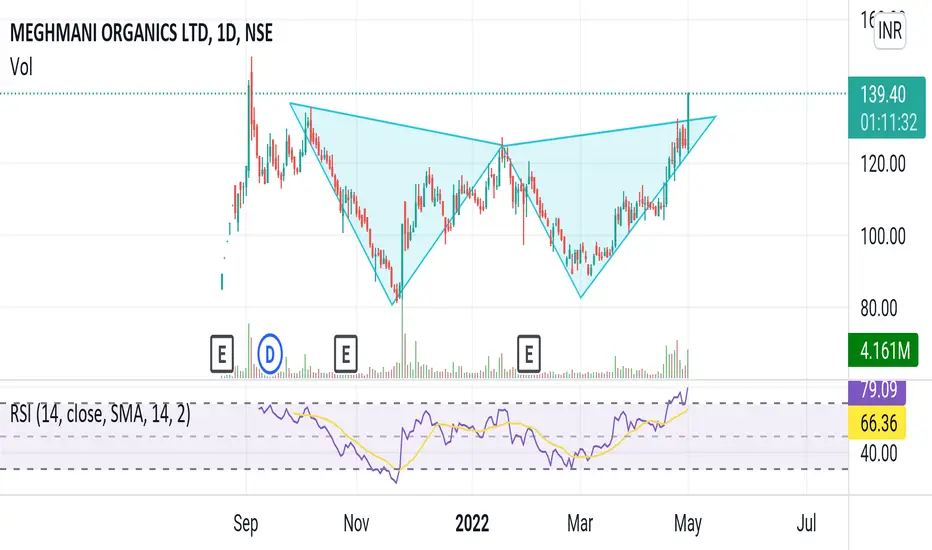
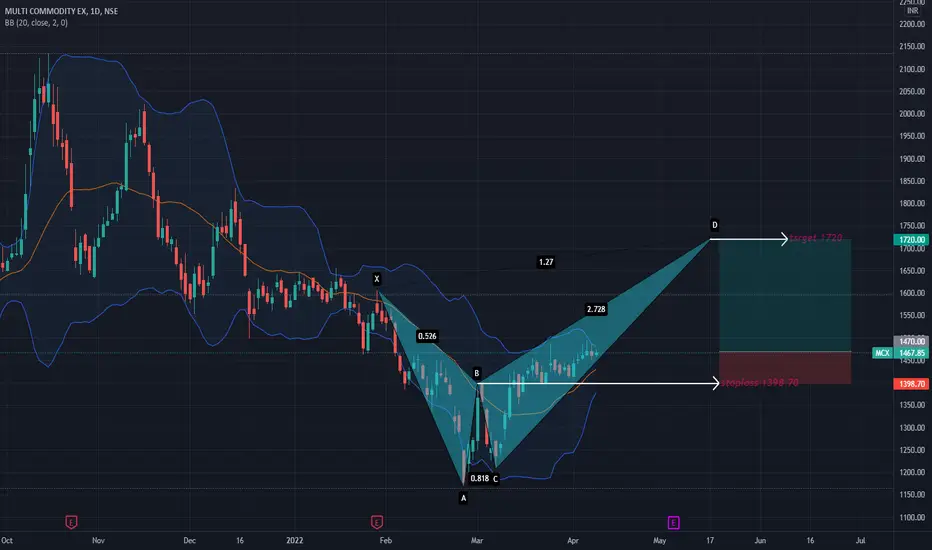
Butterfly
NZDJPY Potential reversal at 87.692, Public Journal #3NZDJPY has been trending up for a long period of time, so I know price will pullback eventually. I've noticed price has now entered a consolidation phase, due to price being exhausted from the endless uptrend, in that consolidation, price has done the peak high, so any short scalpers are now coming into play and trade away from the high.
There is a support level of 85. where many late buyers will use that opportunity to add a long position, because in their eyes, price is still in an uptrend a
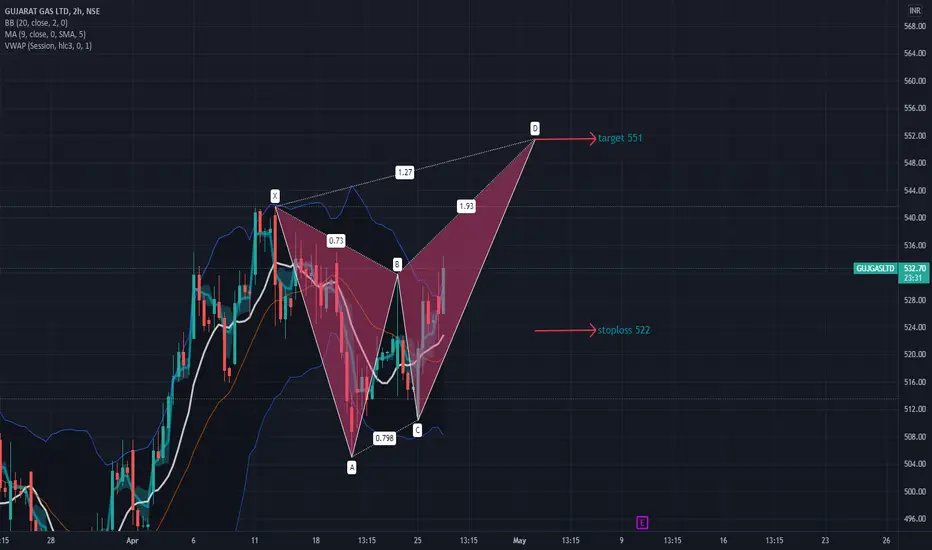
GUJGASLTDGujgas made bullish butterfly pattern on an hourly charts with very good above average volumes & with increase in OI.
Could be bought with mentioned stoploss & targets.
GLong
SLP butterfly pattern can drop price more#SLP/USDT
$SLP broke down from support zone and need to confirm it as support, also it shaped butterfly pattern.
🐻 price can drop more to support zone between $0.011 and $0.009.
🐻🐻 break down from support zone can drop price more to $0.003 to complete Butterfly pattern.
🐮 holding the support zone of $0.009 and break out from resistance zone around $0.018 will invalid the butterfly pattern.
ReNeuron Group (RENE) ... a little gene therapy ??Here's something for you punters and long haulers.
From TV: ..... ReNeuron Group Plc engages in the development of novel cell based therapies that target significant areas of unmet medical need. It develops its core stem cell assets such as CTX neural cell line and human retinal progenitor cells. The company was founded by John David Sinden in 1997 and is headquartered in Pencoed, the United Kingdom.
RENE last 92% of it value from the fall of 2019 and has clawed some of that back in recent we
R
BTC making butterfly harmonic $57,329Price action is developing a harmonic 🦋 Target of this is $57,329. Invalidation of this harmonic will be price going below $38k level or consolidating for a longer period of time. Although it looks we will touch $44k level and pull back but sometimes you cannot anticipate the movement of BTC and it surprises you.
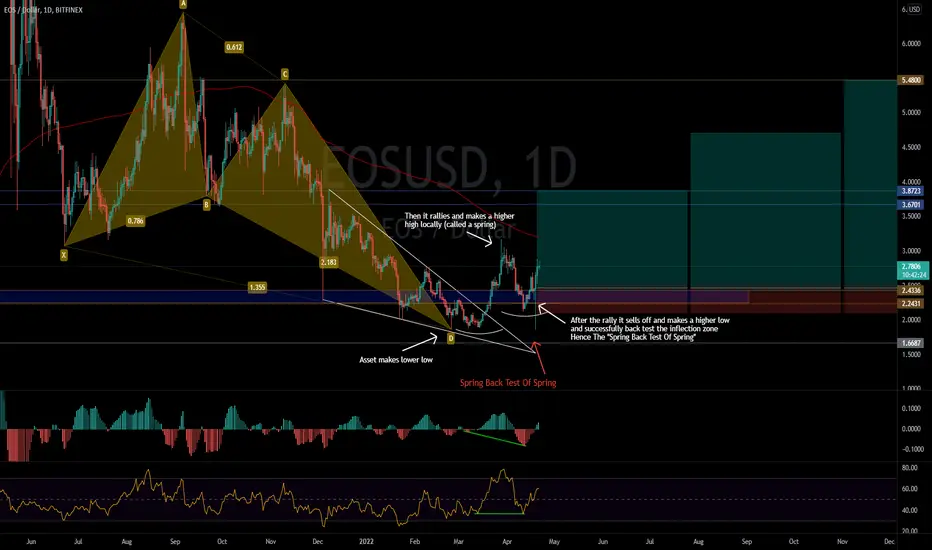
EOS USD | Bullish Butterfly | Spring Back Test Of Spring Hey what's up everyone, EOS is looking insane right now. The stage is certainly set for much higher prices and these are some of the lowest risk levels. I mean just look at the picture of the weekly chart I included, you have a major inflection zone that goes all the way back to 2018. These are levels that buyers historically defend, I want everyone to notice the orange arrow I put on the weekly chart of the spring back test of spring that happened in January 2019. After the successful back test
ELong
Butterfly on GoldWhat you see here is a almost perfectly formed butterfly harmonic in play.
The short trade between $1980 - $1990 is based on the confluences:
- Untapped weekly level
- Untapped POC level (naked point of control)
- 0.5 (swing high to swing low)
- Harmonic retracements: 2.0 (B-C), 1.272 (X-A)
I recommend taking 3 compound trades on the PRZ instead of 1 order.
Stoploss above all the confluence at ~ $2000.
Does anyone think that USDCAD could rise from current? Hmm...My previous long-term idea was based on a fact that triangle could be broken down. Looks like there is good dynamics on it. However, we could see that a pullback has lost a dynamics so I do think that my previous idea is under a huge risk now. So I have tried to make an alternative forecast and see what could happens if USDCAD doesn't fall more.
Attention. It is not a setup or forecast. So, I really don't recommend anyone to trade based on it. Because I still believe that pullback can compl
Butterfly@1.272XAThe " Bearish Butterfly " it's close to completion and close to give us a clue weather it's going to reject the price or letting go, but nevertheless I do confirm this a nice edge to look for a short trade!
Setup Rules:
1. Harmonic Patterns Completion ( Bearish Butterfly@1.272XA) - 95% Complete ;
2. PRZ Hit - Waiting;
3. PRZ Test -Waiting;
4. Candlestick Reversal Sign - Waiting;
5. Candlestick Confirmation Sign -Waiting;
6. RSI Reversal Sign - Waiting;
7. RSI Confirmation Sign -Waiting;
8. Type
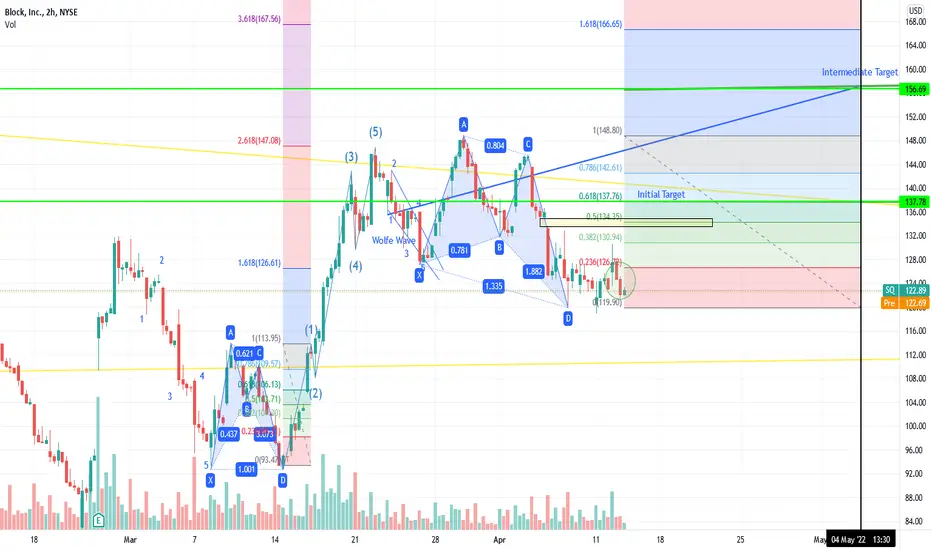
An Intricate BlockA lot of bullishness unfolding here so I will start with the targets and break it down how I got them and why I am so bullish on SQ.
*Initial Target = 138 ; time to target TBD, what I'm looking for is 3 consequtive green candles at the 2 hour level (estimating time to target occurring before the end of April)
**Intermediate Target = 157 by 5/4/2022 - I will explain below
Goal Target is above 166 , but will return to this after the first 2 pts are hit (I can say time to target is after May 4
On the Wings of a ButterflyNear term Bitcoin likely to get some wings - Bullish Butterfly with initial target around 41k. Description of chart below:
- yellow zone would complete butterfly harmonic, expect liftoff from there
- green zone is initial 1.618 target range
- red horizontal line is 3 standard dev. under the displacement of the proportional differences between 9 day s.m.a and price vs. 9 day s.m.a and 20 day s.m.a which is acting as a local over-extension to the down side relative to recent peak around 48k
- do
BTC/USD: Bullish butterflyBitcoin forming a bullish butterfly harmonic pattern and we see that it's a bullish pattern, and also to take in note we forming a bullish divergence in the RSI forming a lower high in RSI and price action lower low. That it's an indication that the trend will going return bullish.
So guys, in H4 it's look bullish.
Are you agreewith this analysis?