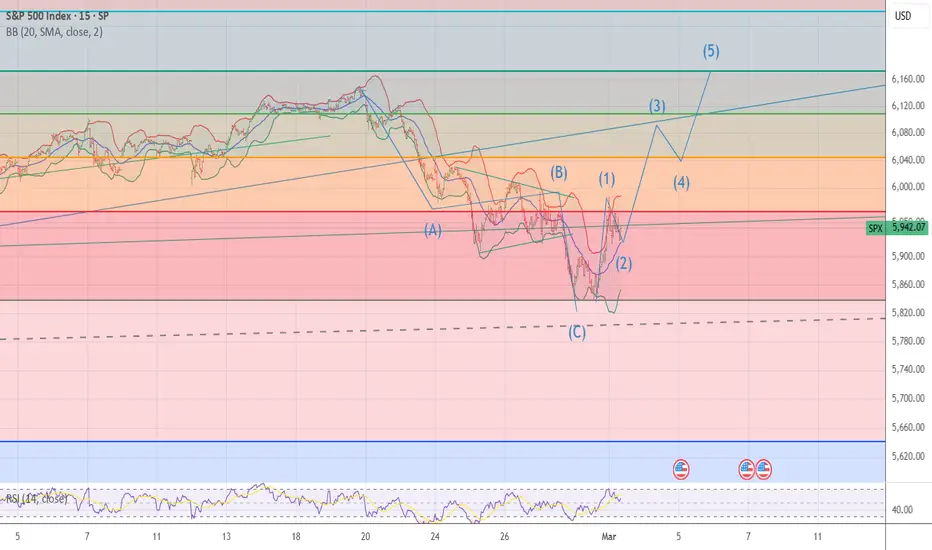
ETHUSD: Double Top into A Bearish 5-0 Breakdown (Extended)Updated Commentary: ETH has extended a bit further than projected as the Pattern Completed at the 0.618 but ETH gapped into the 0.786 instead. The gap up aligned with an upside gap fill on the CME futures as well as a gap fill on the grayscale ETH futures ETF $ETHE. The easier move from here to simply add to the ETH shorts and adjust the stop to be above the previous highs while sizing up at the 0.786 and playing off this gap higher as an anomaly. Beyond this, my view on ETH at the current 0.786
Doji
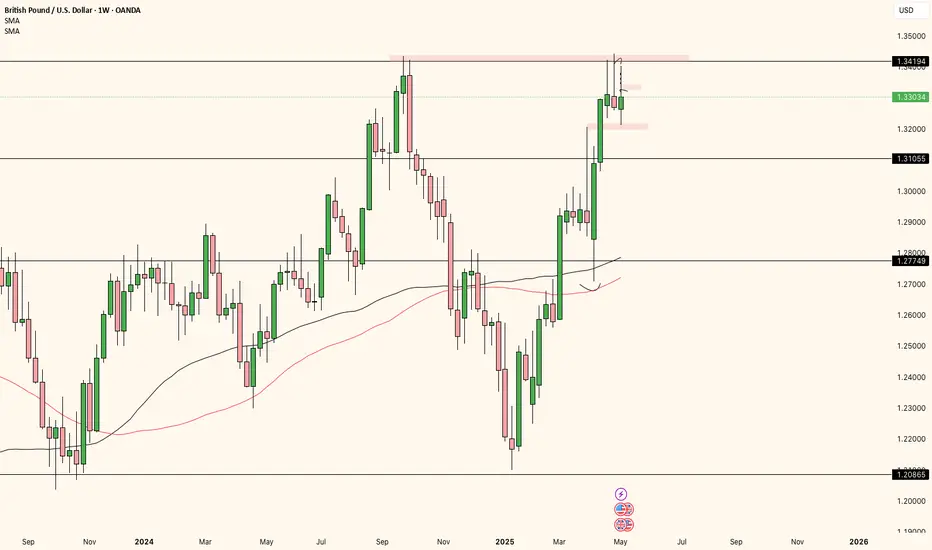
GBPUSD ANALYSISThe weekly candle rejected weekly resistance and closed as a doji for consecutive weeks, which could mean price could be transitioning to a bearish market. Overall price is still bullish, but it did form an H4 LH so I'd look for price to retrace to the H4 support. If price breaks & retest minor M15 support around 1.32970, I'd start looking for sells with my TP being 1.32100.
Daily and weekly poised for a bull run, BULL FLAG $SKLZPersonally see 6.89-7.33 in the coming weeks potentially 9$-10$ by summer with momentum and positive ER. SKLZ is a sleeping giant
Many analyst say its a buy and the chart is bullish for a 6month swing trade easy or a great long term position. Final time we see south of 5$ !?
We shall see, in time
SLong
$GLD - bullish momentum soon to stallHello, I was bullish on AMEX:GLD for a bit and now examining the charts, multiple frames, this may be setting up for a good short. If geopolitics and tariff talks deescalate then this should cool off. The Elliot wave placed indicates some time for a correction/pull back on this hot commodity and the candle on the Daily from Friday is a spinning stop doji which can indicate reversal in an uptrend. Also, we have so many gaps up that happened in 3 day span, crazy actually. I labeled areas of targ
ADA last chance to get in? Are you allocated into ADA? Why not? It just pumped almost 100% yesterday because of Trumos Twitter Tweet. Imagine what happens when the general public finds out this. Or will it never happen?
Was this your last chance to get in cheap?? We just touched the 78.6 fib... Are we going up?
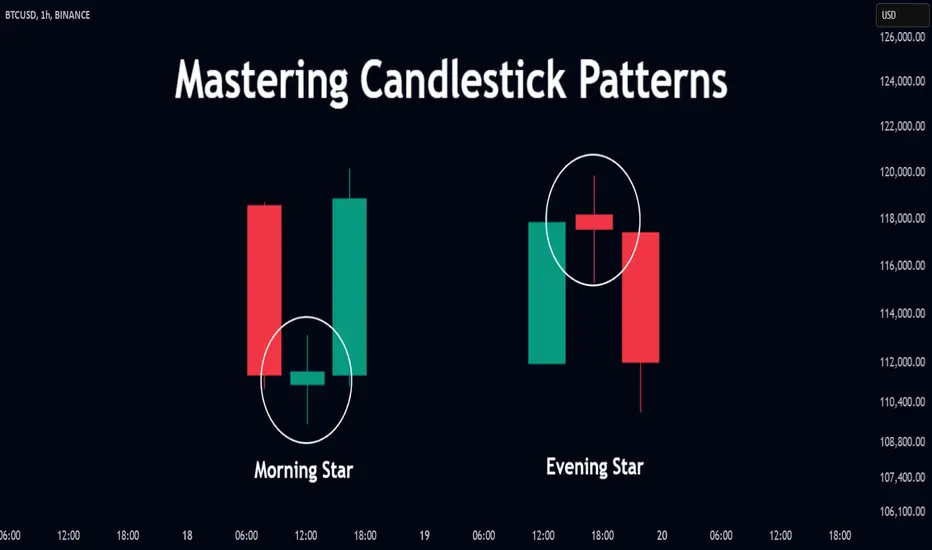
Mastering Candlestick Patterns for better trades!Candlestick patterns are a powerful tool for identifying market sentiment and potential reversals. Let's break down some key single and double candlestick formations seen in this chart:
🕯️Single Candlestick Patterns:
- Doji – Represents indecision in the market, signaling a potential reversal.
- Inverted Hammer – A bullish reversal pattern after a downtrend, indicating buyers are stepping in.
- Long-Legged Doji – Suggests market uncertainty; watch for confirmation before taking a position.
- Be
Mastering Candlestick Patterns: Visual Guide for Traders
🔵 Introduction
Candlestick charts are among the most popular tools used by traders to analyze price movements. Each candlestick represents price action over a specific time period and provides valuable insights into market sentiment. By recognizing and understanding candlestick patterns, traders can anticipate potential price reversals or continuations, improving their trading decisions. This article explains the most common candlestick patterns with visual examples and practical Pine Script c
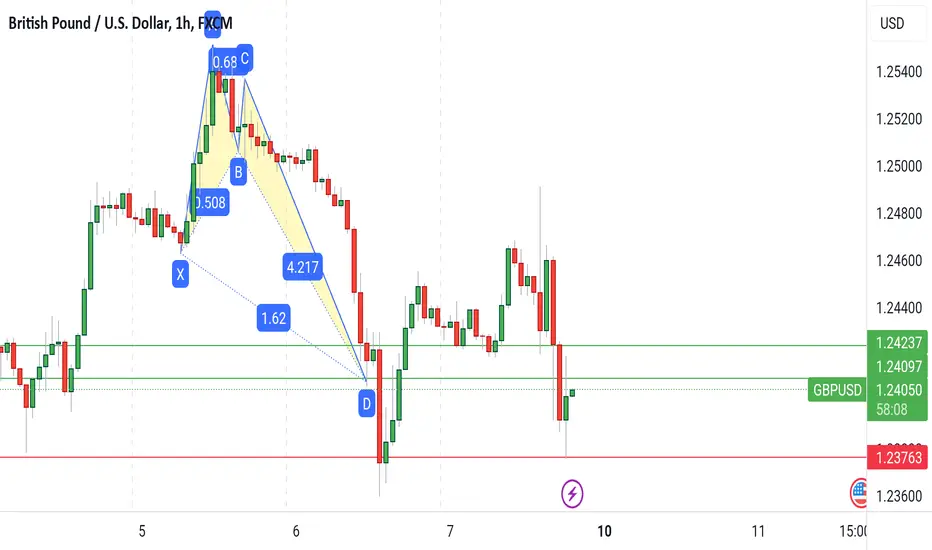
GBPUSD BULLISH CRABHarmonic Pattern Trading Strategy:
1. Combine patterns with 2-3 confirmations (e.g., MA, BB, RSI, Stoch) for increased accuracy.
2. Implement proper risk management.
3. Limit exposure to 3% of capital per trade.
4. Exercise caution: Not every Harmonic Pattern presents a good trading opportunity.
5. Conduct thorough diligence and analysis before trading.
Disciplined approach = Enhanced edge.
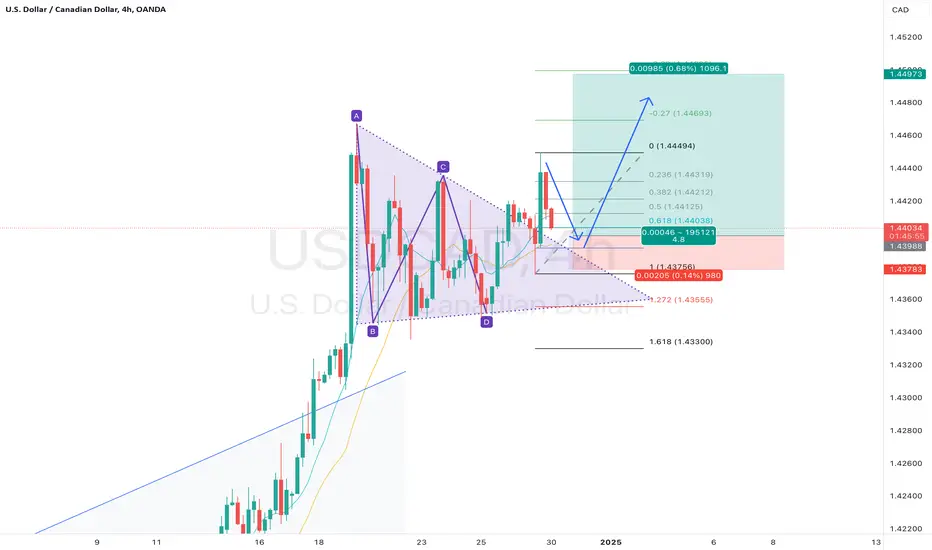
NZDCHF BATHarmonic Pattern Trading Strategy:
1. Combine patterns with 2-3 confirmations (e.g., MA, BB, RSI, Stoch) for increased accuracy.
2. Implement proper risk management.
3. Limit exposure to 3% of capital per trade.
4. Exercise caution: Not every Harmonic Pattern presents a good trading opportunity.
5. Conduct thorough diligence and analysis before trading.
Disciplined approach = Enhanced edge.
ZEN Skyrockets 244% – Is a Correction Around the Corner?ZEN has experienced an impressive +244% rally over the past 7 days, completing 7 consecutive bullish days.
Key Resistance Levels:
0.618 Fibonacci Retracement: Reached for the entire structure (logarithmic scale), providing an ideal short entry.
0.666 Fibonacci Retracement: Located at $53.55, perfectly aligning with the previous significant swing high, further strengthening resistance at this level.
Psychological Level: $50 serves as a critical psychological barrier.
The rally
NEAR - Primed for Action: Long Setup to $6 NEAR experienced a strong bounce after a significant sell off. The price has now retraced into the golden pocket zone (0.618–0.666 Fibonacci retracement) and appears to be accumulating within this range atm.
Key Observations and Trade Setups:
Accumulation at Golden Pocket:
The formation of a trading range in this area indicates that buyers are stepping in.
Once volume begins to pick up, it could signal the start of an upward move.
Upside Target:
Using the Trend-Based Fibonacci Extension
AES Corporation - Short term view with strong supportSo first of all both price and indicators are confirming the downtrend.
Today NYSE:AES opened with a gap succeeding yesterday's equilibrium in price with doji candles.
The price is still in the middle of the regression line and in the next few days the price don't seems to be close to upper 2 SD.
In the print above the yellow line shows the support at $11.43. The image's time horizon starts at the end of 2006.
Furthermore looking at short ratio available online the value is about 2,7 from
FTM long ideaFTM pushed quite high today, wait for a retracement to at least 0.61 fib level for a healthy pull back, then check if there is a reaction around that level, it will ready to continue its move up!
FLong
Short term trading : Be carreful of this candlestick config !!!You can acknowledge with me the absolutely astonishing XRP perf but when it's too nice to be true, a pull back does occur at some point. Please consider this not as a financial advice but educational content
Take care _
Do sport _
Take profit _
MINDA CORP 61% retrace with Decrease in volumeHello Everyone,
Minda Corp Trading at 494 after making lifetime high oe 645 its retrace fibbo 61% also trading at EMA 200 levels at daily timeframe, Decrease in price with decrease in volume wit RSI oversold and Positive divergence goood long set up possibility for swing as well as positional.
Top 3 Must-Know Candlestick Patterns for BeginnersGet your cup of coffee or tea ready we are doing a crash course on Candlesticks today
I’m walking you through three candlestick patterns every beginner trader should know—Doji, Engulfing Candles, and Hammers (including the Inverted Hammer). These patterns are super helpful when you’re trying to spot market reversals or continuations. I’ll show you how to easily recognize them and use them in your own trades. Let’s keep it simple and effective.
Key Takeaways:
Doji: Indicates indecision, poten