Palantir Daily: 200 EMA Test Offers High-Probability Bearish RejPalantir Technologies Inc. ( NASDAQ:PLTR ) is displaying a highly strategic structural setup on the Daily Chart, trading inside a well-defined macro range while preparing for a key dynamic resistance test.
The stock remains fundamentally boxed between the major horizontal resistance wall at **161.27** and the solid institutional demand floor at **122.35**.
### Key Technical Factors:
* **The Micro Trendline Breakout:** In the short term, PLTR managed to break above its minor descending trendli
Exponential Moving Average (EMA)
WTI Crude Oil Daily: Triangle Breakdown Triggers Macro CorrectioCrude Oil (WTI - TVC) has officially broken out of its multi-month consolidation phase on the Daily Chart, validating a significant structural shift.
The symmetrical triangle pattern we were tracking has seen a decisive bearish breakdown, clearing the lower ascending trendline support and shifting short-term control firmly to the sellers.
### Key Technical Factors:
* **The Trendline Breakdown:** The daily candle has closed cleanly below the green ascending support line that has held price acti
EUR/AUD Bullish Retest Above EMA 50EUR/AUD continues to hold above the EMA 50, keeping the bullish momentum intact for now. I’ll be looking for a clean bullish retest before considering any long positions.
As long as the pair respects the current support structure and maintains strength above the EMA 50, buyers could attempt another push toward higher levels. The main upside target remains at 1.63004.
A confirmed bullish retest could provide a strong continuation setup for further upside movement.
Disclaimer
This analysis is
$USDT.D + $USDC.D Bull Flag looks Ready to RipAfter falling 6 straight weeks, Stablecoin dominance is back on the rise after successfully testing the 50% Gann retracement and reclaiming the POI between the .618 Fib with 2 consecutive Weekly Closes.
Note the bull flag that has been forming here on CRYPTOCAP:USDT.D + CRYPTOCAP:USDC.D
When PA breaks outside this POI, we should expect the next big leg down in the crypto market.
XAUUSD 15M — Aligned Bearish Deepens, $4,484 Below EMA200May 20 Cross-Asset SMC Read
Gold's bearish alignment continues to deepen. Since flipping to aligned SHORT on May 4, Gold has not looked back — dropping from $4,562 through $4,666 (May 11) and now to $4,484. That is nearly $80 of additional downside in nine days.
Price remains firmly below the EMA200 ($4,520), and the 15M structure shows a clean series of bearish BoS labels. The most recent session saw a drop to the $4,440 area before a modest bounce into London. No bullish structural shift
EURUSD 15M — Bullish Structure Intact | Only Full Long AlignmentStructure: Bullish
EMA200: Above
Bias: LONG (Aligned)
EURUSD continues to stand apart from the broader risk-off picture. Price is trading above the EMA200 near 1.1757, with multiple bullish BoS signals printed throughout the week. Structure has held despite minor pullbacks.
Current price near 1.1771. The lone full bullish alignment across all four tracked assets today.
Key levels:
• Resistance: 1.1780–1.1800
• Support: 1.1730 (EMA200)
• Below that: 1.1700
Both signals aligned LONG
BTCUSD 15M — Swept 82,200 Then Reversed | Back Below EMA200Structure: Bearish
EMA200: Below
Bias: SHORT (Aligned)
BTC made a push to 82,200 during the week — appearing briefly like a bullish continuation — before printing a sharp bearish BoS from the highs. Price is now back below the EMA200, near 80,700.
The full reversal arc that began in early May is intact. Structure and EMA200 both confirm short bias.
Key levels:
• Resistance: 81,000–81,400 (EMA200 area)
• Support: 79,400 (prior swing low)
• Below that: 79,000
Both signals aligned SH
EURUSD: Full Bullish Alignment — Strongest EMA200 Margin in WeekSmartFlow SMC Daily Cross-Asset Analysis — May 8
EUR has completed a full recovery. On May 4 it was Aligned Bearish at 1.1716, sitting below EMA200. Today at 1.1772, price has reclaimed the EMA200 (1.1742) with +30 pips of margin, and structure is confirmed Bullish.
Key Observations:
The rally from the 1.1680 low was clean — multiple bullish BoS labels visible, with price breaking through the EMA200 crossover zone and holding above. The MSS label near 1.1730 area marked the structural s
Apple Dip = Opportunity?AAPL - CURRENT PRICE : 252.82
Most traders panic during pullbacks… but professionals wait for them.
Right now, Apple Inc. is pulling back into one of the most important zones on the chart — the EMA 200, a level that has repeatedly acted as dynamic support and resistance (as clearly shown by the green highlighted areas). Every time price revisits this zone, it reveals where smart money steps in.
What makes this setup even more interesting is the recent bullish harami candlestick pattern. Th
NAS100: Steady Bull No More — Structure Cracked at $27,900SmartFlow SMC Daily Cross-Asset Analysis — May 4
NAS has been the most consistent bull throughout this entire tracking period. That streak ended today. Structure flipped Bearish after the rejection from $27,900, though price remains $173 above EMA200 ($27,614). Conflict state.
Key Observations:
The push above $27,800 met resistance and produced a structural breakdown. BoS labels confirm the shift, and an MSS label is visible near $27,700 marking the crack. EQL labels in the $27,400 zone
EURUSD: Bullish Alignment Collapsed — Full Bearish in 3 DaysSmartFlow SMC Daily Cross-Asset Analysis — May 4
EUR's full bullish alignment — achieved just 3 days ago — has completely collapsed. Price at 1.1717 is now below EMA200 (1.1722). Structure is Bearish. Full bearish alignment confirmed.
Key Observations:
On May 1, EUR was the celebration story — the knife's edge resolved bullish at 1.1748 with +29 pips of cushion. Today, all of that is gone. The sell-off from the 1.1790 high was sharp, with BoS and MSS labels confirming the structural bre
BTCUSD: Structure Cracked — Bearish Above EMA200SmartFlow SMC Daily Cross-Asset Analysis — May 4
BTC's full bullish alignment lasted just 3 days. Structure has flipped Bearish after the rejection from the $80,000 level, but price remains $112 above EMA200 ($78,793). The conflict state is back.
Key Observations:
The push to $80,000 was met with aggressive selling, creating a clear structural break. The BoS labels on the way down from $79,800 to $78,700 confirmed the bearish shift. An MSS↓ label is visible at the structural break point
NAS100: Bullish Alignment Holds — Leading the PackSmartFlow SMC Daily Cross-Asset Analysis — May 1
NAS continues its full bullish alignment and has extended its lead. Price at $27,675 sits +$299 above EMA200 ($27,376) — up from +$188 on Apr 24. The widest NAS margin in recent sessions.
Key Observations:
The push from $26,950 to $27,700 was a staircase rally with BoS labels marking each step higher. The structure is clean — no MSS threats visible on the current chart. EQH and EQL labels show orderly liquidity sweeps along the way.
An
EURUSD: Conflict Resolved — Full Bullish Alignment AchievedSmartFlow SMC Daily Cross-Asset Analysis — May 1
EUR was on the knife's edge at 1.1700 vs EMA200 1.1702 on Apr 24. Today: resolved bullish. Price at 1.1748, EMA200 at 1.1719 — comfortably above with +29 pips of margin. Full bullish alignment confirmed.
Key Observations:
The rally from the 1.1660 base through 1.1750 was clean, with BoS confirmations along the way and multiple EQH/EQL labels showing the structural progression. An MSS↓ candidate sits near 1.1730 — that's the structural flo
BTCUSD: Full 180 — From Aligned Bearish to Aligned BullishSmartFlow SMC Daily Cross-Asset Analysis — May 1
BTC has completed the most dramatic reversal in this tracking period. On Apr 24 it was fully aligned bearish (Bearish + Below EMA200). Today it's fully aligned bullish (Bullish + Above EMA200) — a complete 180-degree flip.
Key Observations:
The rally from $74,800 to $78,238 was structural. Multiple BoS labels confirmed the bullish trend on the way up, with a clear MSS label marking the original shift point. Price now sits +$1,539 above EM
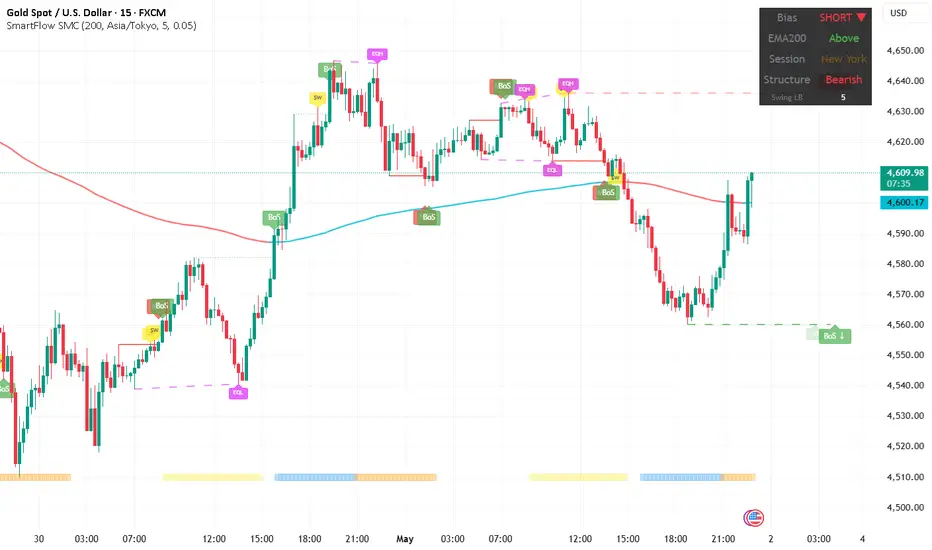
XAUUSD: The Lone Holdout — Bearish Above EMA200SmartFlow SMC Daily Cross-Asset Analysis — May 1
Gold is the only asset not fully aligned bullish — and it's showing a fascinating conflict. Price sits just $5 above the EMA200 ($4,600), but structure is Bearish after a clean rejection from the $4,640 zone. The BoS confirmations on the way down from $4,640 to $4,560 were textbook, followed by a bounce back above EMA200 that hasn't yet flipped structure.
Key Observations:
On Apr 24, Gold's conflict was Bullish/Below — the opposite of tod
NAS100: Conflict Resolved — Full Bullish Alignment ReturnsSmartFlow SMC Daily Cross-Asset Analysis — Apr 24
NAS resolved its conflict — and chose the bullish side. Structure flipped back to Bullish while price remains well above EMA200 ($26,868). Full bullish alignment: Bullish structure + Above EMA200.
Key Observations:
NAS surged from $26,650 to $27,100+ in a powerful move, with clear BoS confirmations along the way and an MSS label at the structural shift. Price is now $188 above EMA200 — the strongest margin of any asset today.
Watch for
EURUSD: Bullish Below EMA200 — Conflict Holds Into LondonSmartFlow SMC Daily Cross-Asset Analysis — Apr 24
EUR mirrors Gold's conflict state. Structure is Bullish after the bounce from the 1.1660 low, but price at 1.1700 sits right at the EMA200 line (1.1702). The gap is essentially zero — EUR is on the knife's edge.
Key Observations:
The strong sell-off from 1.1800+ to 1.1660 was followed by a structural flip. Multiple BoS labels confirmed the bullish reversal. But the EMA200 is acting as resistance — price has tagged it and stalled.
Watch
BTCUSD: Conflict Resolved — Full Bearish AlignmentSmartFlow SMC Daily Cross-Asset Analysis — Apr 24
BTC resolved its conflict signal — and chose the bearish side. Price dropped below the EMA200 ($77,698), confirming full bearish alignment: Bearish structure + Below EMA200. Yesterday BTC was Bearish/Above — today the anchor broke.
Key Observations:
The drop from $79,800 to $77,644 was clean, with multiple BoS confirmations on the way down and an MSS label visible at the structural shift point. Price is now just $54 below EMA200 — a thin
XAUUSD: Bullish Structure Below EMA200 — Conflict ContinuesSmartFlow SMC Daily Cross-Asset Analysis — Apr 24
Gold continues its conflict signal. Structure is Bullish after a BoS confirmation, but price sits $33 below the EMA200 at $4,712. The V-shape recovery from the $4,660 low shows demand stepping in, but sellers are defending the EMA200 zone aggressively.
Key Observations:
After yesterday's historic all-four-in-conflict reading, Gold remains unresolved. The bullish structure suggests dip-buying interest is alive, but staying below EMA200 me
XAUUSD: Conflict Signal at $4,720 — Bullish Below EMA200█ STRUCTURE
Gold at $4,720 with LONG/Below/Bullish. The conflict signal persists — bullish structure fighting below EMA200 ($4,744). Price is $24 below.
Another sharp drop-and-recovery cycle: price fell from $4,810 to $4,690 before staging a V-shape recovery to $4,720. MSS and BoS labels show the structural flip back to bullish during the recovery, but EMA200 remains overhead.
This is the pattern gold has been stuck in for over a week — drop below EMA200, flip bullish on the recovery, att
NAS100: Bullish but Thin — $26,668 Just $48 Above EMA200█ STRUCTURE
NAS100 at $26,668 with LONG/Above/Bullish. NAS maintains its bullish stance but the margin above EMA200 ($26,620) has shrunk to just $48 — the thinnest in weeks. MSS labels and volatile BoS patterns on the right side show the bulls are fighting to hold.
The chart tells a choppy story: $26,780 high → sharp drop → MSS → recovery → BoS → another drop. The whipsaw pattern suggests NAS is losing the clean trend character it maintained throughout April. EMA200 is rising fast and appro
URUSD: Bullish Recovery Below EMA200 — 1.1749 After 1.1720█ STRUCTURE
EURUSD at 1.17486 with LONG/Below/Bullish. Same conflict as gold — bullish structure has returned but price remains below EMA200 (1.17588). The pair dropped sharply from 1.1850 to 1.1720, then recovered with bullish BoS and MSS↑ confirmation.
The chart shows the week's deterioration from the 1.1850 high: bearish BoS through 1.1800 → 1.1770 → 1.1720 low → today's recovery. The bullish flip is fresh, with BoS↑ visible at the right edge. Price is 10 pips below EMA200.
Multiple EQ
XAUUSD: V-Shape Recovery from $4,670 — Conflict at $4,752█ STRUCTURE
Gold at $4,752 with LONG/Below/Bullish. The conflict signal is back — bullish structure below EMA200 ($4,770). But the story today is the V-shape recovery.
Price crashed from $4,810 to below $4,670 — a $140 drop — before staging a sharp recovery with bullish BoS stacking all the way back to $4,752. The recovery shows real buying interest at the lows, with BoS confirmed at $4,700, $4,730, and now pushing $4,750.
EMA200 has dropped to $4,770, and price is $18 below it. The bulli