XAUUSD: Bullish Structure Below EMA200 — Conflict ContinuesSmartFlow SMC Daily Cross-Asset Analysis — Apr 24
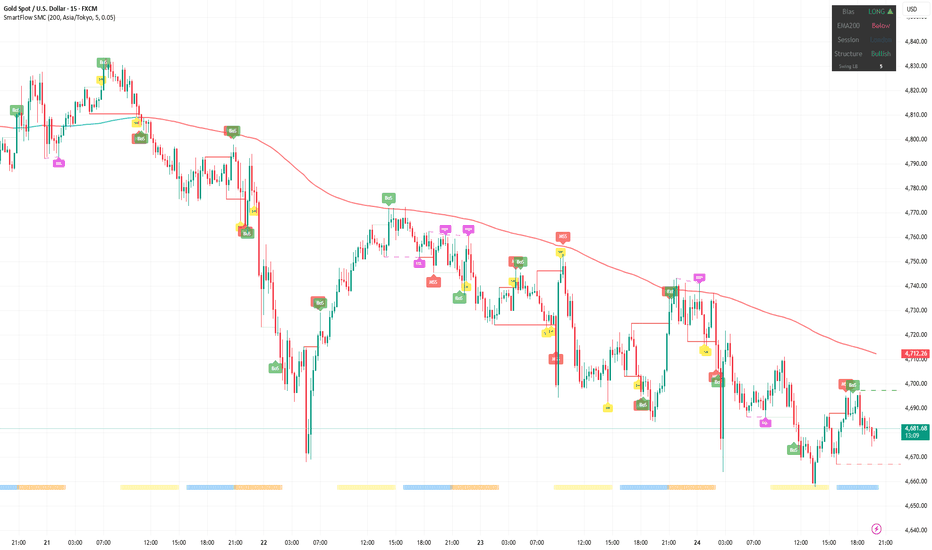
Gold continues its conflict signal. Structure is Bullish after a BoS confirmation, but price sits $33 below the EMA200 at $4,712. The V-shape recovery from the $4,660 low shows demand stepping in, but sellers are defending the EMA200 zone aggressively.
Key Observations:
After yesterday's historic all-four-in-conflict reading, Gold remains unresolved. The bullish structure suggests dip-buying interest is alive, but staying below EMA200 me
Engulfing Candle
XAUUSD: Conflict Signal at $4,720 — Bullish Below EMA200█ STRUCTURE
Gold at $4,720 with LONG/Below/Bullish. The conflict signal persists — bullish structure fighting below EMA200 ($4,744). Price is $24 below.
Another sharp drop-and-recovery cycle: price fell from $4,810 to $4,690 before staging a V-shape recovery to $4,720. MSS and BoS labels show the structural flip back to bullish during the recovery, but EMA200 remains overhead.
This is the pattern gold has been stuck in for over a week — drop below EMA200, flip bullish on the recovery, att
NAS100: Bullish but Thin — $26,668 Just $48 Above EMA200█ STRUCTURE
NAS100 at $26,668 with LONG/Above/Bullish. NAS maintains its bullish stance but the margin above EMA200 ($26,620) has shrunk to just $48 — the thinnest in weeks. MSS labels and volatile BoS patterns on the right side show the bulls are fighting to hold.
The chart tells a choppy story: $26,780 high → sharp drop → MSS → recovery → BoS → another drop. The whipsaw pattern suggests NAS is losing the clean trend character it maintained throughout April. EMA200 is rising fast and appro
URUSD: Bullish Recovery Below EMA200 — 1.1749 After 1.1720█ STRUCTURE
EURUSD at 1.17486 with LONG/Below/Bullish. Same conflict as gold — bullish structure has returned but price remains below EMA200 (1.17588). The pair dropped sharply from 1.1850 to 1.1720, then recovered with bullish BoS and MSS↑ confirmation.
The chart shows the week's deterioration from the 1.1850 high: bearish BoS through 1.1800 → 1.1770 → 1.1720 low → today's recovery. The bullish flip is fresh, with BoS↑ visible at the right edge. Price is 10 pips below EMA200.
Multiple EQ
XAUUSD: V-Shape Recovery from $4,670 — Conflict at $4,752█ STRUCTURE
Gold at $4,752 with LONG/Below/Bullish. The conflict signal is back — bullish structure below EMA200 ($4,770). But the story today is the V-shape recovery.
Price crashed from $4,810 to below $4,670 — a $140 drop — before staging a sharp recovery with bullish BoS stacking all the way back to $4,752. The recovery shows real buying interest at the lows, with BoS confirmed at $4,700, $4,730, and now pushing $4,750.
EMA200 has dropped to $4,770, and price is $18 below it. The bulli
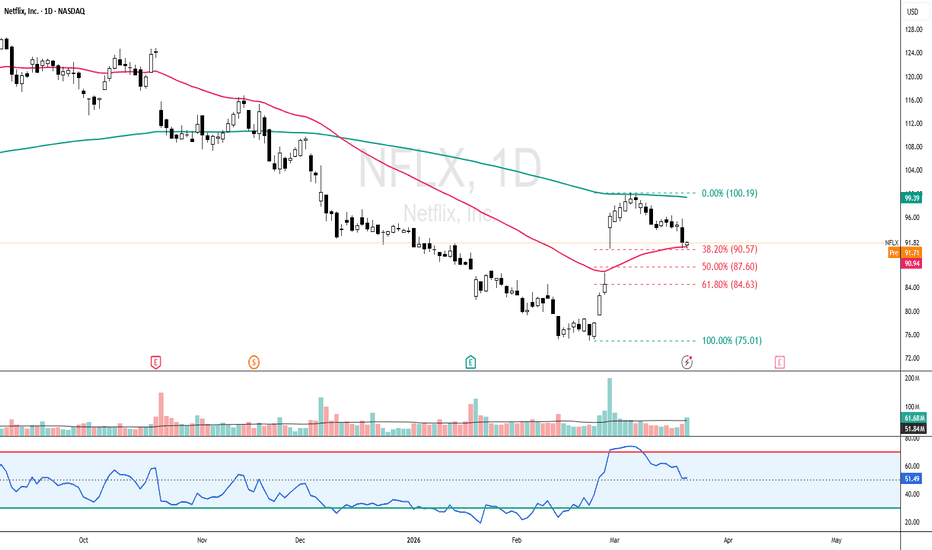
NETFLIX - Buy The Dip: Confluence Support HoldingNFLX - CURRENT PRICE : 91.82
Netflix is showing a constructive pullback into a confluence support zone, where price is retracing toward the EMA 50 while simultaneously testing the gap-up demand area. The retracement is also holding near the Fibonacci 38.2% golden ratio, which typically acts as a healthy correction within a developing rebound structure. This combination suggests selling pressure is fading and buyers are stepping in at higher levels, increasing the probability of a continuation
EURUSD: Reclaimed EMA200 — Bullish Again at 1.1795 After Dip█ STRUCTURE
EURUSD at 1.17946 with LONG/Above/Bullish. Yesterday's "first ever bearish alignment" lasted exactly one session. EUR has reclaimed EMA200 (1.17835) and structure has flipped back bullish with MSS↑ confirmed.
The chart shows a wide range: 1.1690 base → 1.1830 high → pullback through EMA200 → yesterday's bearish reading → today's recovery above EMA200. The BoS↑ label at the right edge confirms buyers retook control during London session. Price is $11 pips above EMA200 — thin but
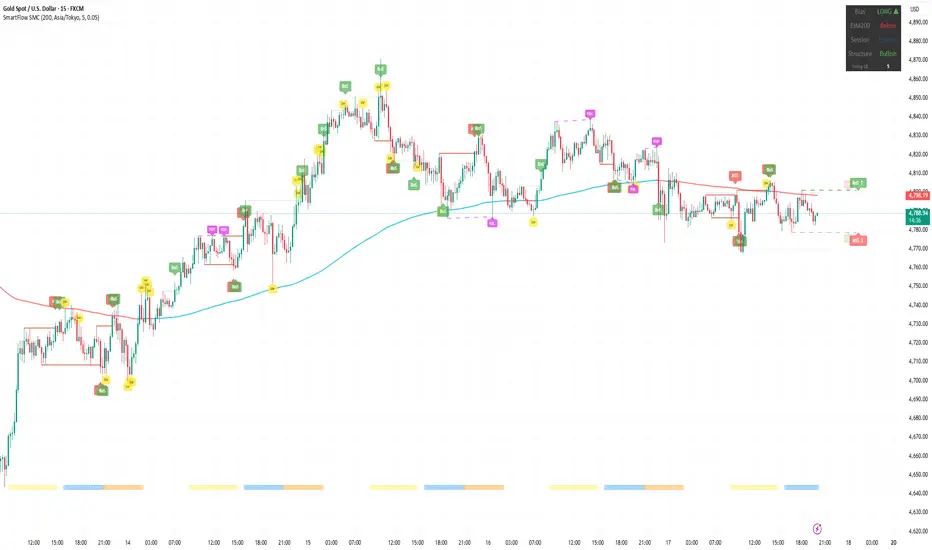
XAUUSD: Below EMA200 but Bullish Again — $4,786 in Conflict█ STRUCTURE
Gold at $4,786 with LONG/Below/Bullish. The conflict signal returns. Structure has flipped back bullish with MSS↑ confirmed and BoS↑ printing, but price remains below EMA200 ($4,798) — $12 short of reclaiming it.
This is the same pattern from Apr 13: bullish structure below EMA200. Last time it resolved with a bullish reclaim. The chart shows the pullback from $4,860 → $4,770 lows → recovery with bullish BoS stacking through $4,780, $4,790, now testing $4,800.
The MSS at $4,80
XAUUSD: Back Above EMA200 — Bullish Reclaim at $4,782 █ STRUCTURE
Gold at $4,782 with LONG/Above/Bullish. The conflict signal from yesterday (Below but Bullish) has resolved — gold reclaimed EMA200 ($4,747) and structure is now fully aligned bullish.
The recovery from last week's $4,660 low has been relentless. Bullish BoS stacking from $4,700 through $4,740, $4,760, and now pushing $4,790. The EMA200 that acted as resistance for multiple sessions has flipped back to support.
Multiple SW labels show active liquidity sweeps, and BoS labels co
NAS100: Holding Bullish Above EMA200 — $25,004 vs $24,972█ STRUCTURE
NAS100 at $25,004 with LONG/Above/Bullish. NAS continues to outperform relative to the group, maintaining bullish structure above EMA200 ($24,972) with a $32 cushion.
After the volatile week — $25,280 high → pullback to $24,800 → recovery — NAS has stabilized above EMA200. The BoS labels on the right side confirm bullish structure is intact, though the margin is thin. Multiple EQH clusters around $25,100-25,200 show resistance above.
█ KEY LEVELS
Resistance: $25,100-25,2
EURUSD: Bullish but Barely Above EMA200 — 1.1693 vs 1.1689█ STRUCTURE
EURUSD at 1.16927 with LONG/Above/Bullish, but the margin above EMA200 (1.16888) has shrunk to just 4 pips. This is the tightest EMA200 proximity across all four assets.
The pullback from 1.1740 has been significant — over 50 pips in a few sessions. Multiple MSS and BoS labels show a choppy structure with both bulls and bears fighting. The bullish structure is technically intact, but the proximity to EMA200 makes this a pivotal moment.
The right side of the chart shows SW labe
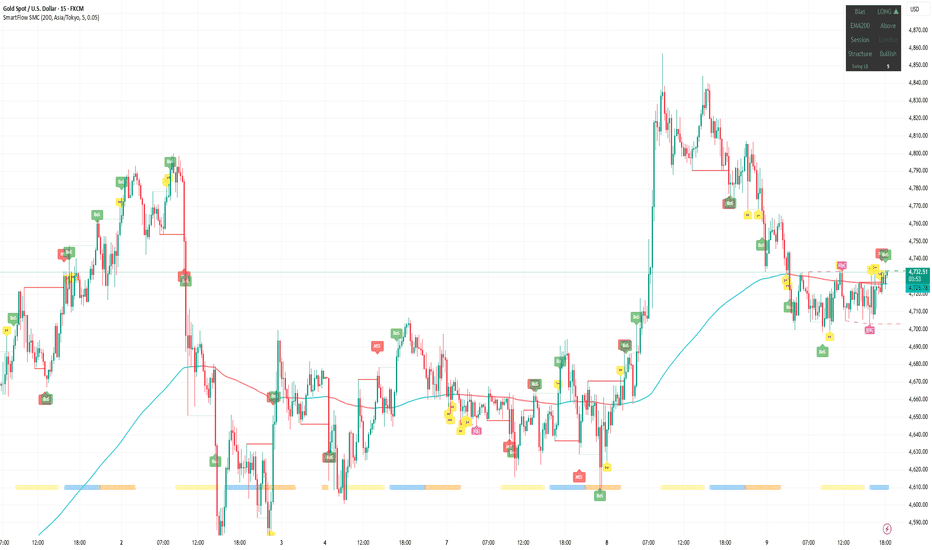
XAUUSD: Bullish Structure Below EMA200 — Conflict at $4,720█ STRUCTURE
Gold at $4,720 with LONG/Below/Bullish. This is a conflict signal — structure has flipped back bullish but price sits below EMA200 ($4,736). The indicator is reading bullish BoS on the recovery from recent lows, but the EMA200 overhead is now resistance.
The chart tells a volatile week: $4,870 high on Apr 8 → selloff to $4,640 → recovery attempts with bullish BoS stacking → current price oscillating around EMA200. Multiple SW labels and EQH clusters show heavy two-way activity.
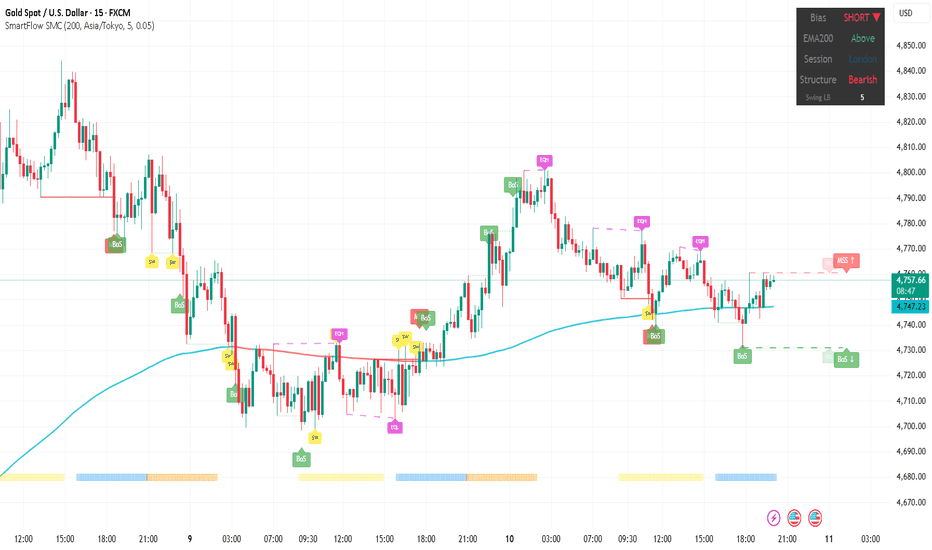
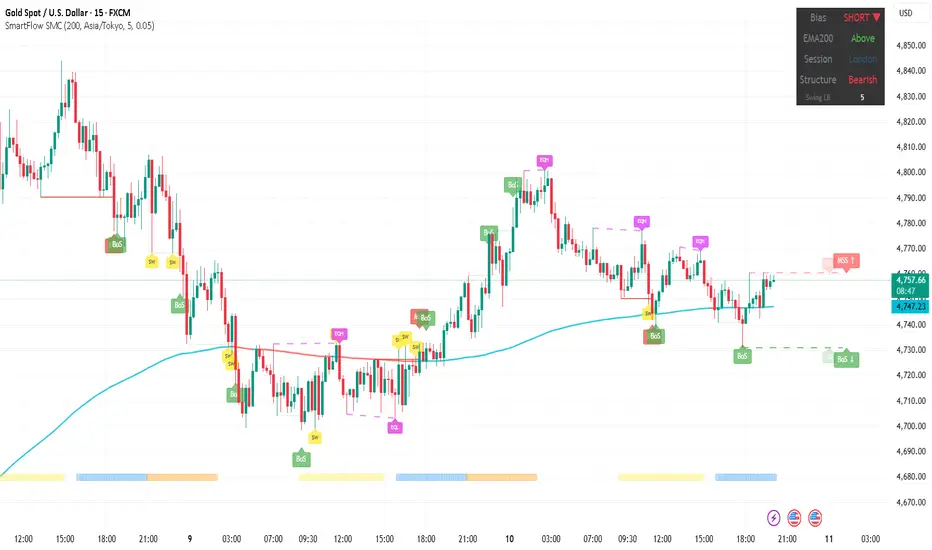
XAUUSD: Structure Flipped Bearish — $4,757 Still Above EMA200█ STRUCTURE
Gold at $4,757 with SHORT/Above/Bearish. A significant change from yesterday's bullish reading. The structure has flipped bearish while price remains above EMA200 ($4,747) — this "Above but Bearish" conflict signal is the same pattern NAS100 showed yesterday.
After yesterday's $4,870 high, the selloff deepened through $4,780 and triggered a bearish structure shift. Multiple BoS labels confirm the downtrend on 15min. Price is now sitting just $10 above EMA200 — extremely tight.
XAUUSD: $4,870 to $4,730 — Testing EMA200 as Support█ STRUCTURE
Gold at $4,730 with LONG/Above/Bullish. After yesterday's spike to $4,870, price has pulled back to the EMA200 zone ($4,725) — a critical test.
The rally from $4,600 was powerful, with bullish BoS stacking all the way up. But the $140 pullback from $4,870 brings price right to EMA200 as support. This is the exact test that defines whether the uptrend continues: EMA200 acted as resistance for weeks, then was reclaimed, and now needs to prove itself as support.
The BoS and SW la
XAUUSD: Back Below EMA200 — $4,760 to $4,621 Overnight█ STRUCTURE
24 hours ago, gold was at $4,760 with a clean bullish structure above EMA200. Today: SHORT/Below/Bearish at $4,621.
The selloff from $4,760 was sharp — bearish BoS confirmed and price dropped back below EMA200 (cyan ~$4,666). An MSS↑ candidate sits on the right edge, suggesting a potential bounce, but the structure has officially flipped bearish again.
This raises a critical question: was the entire $4,350 → $4,760 rally just another failed bounce in the larger downtrend? Or i
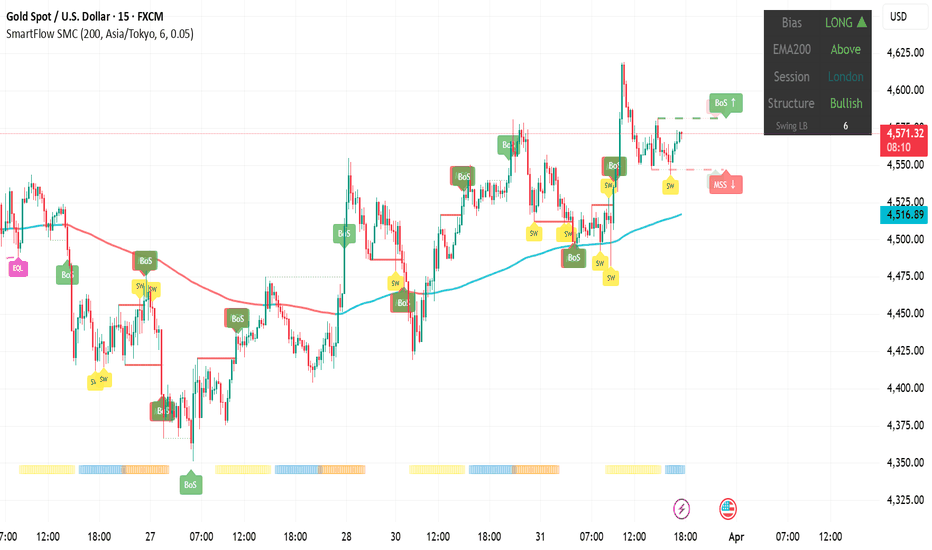
XAUUSD: Holding Above EMA200 — But MSS Candidate Lurking█ STRUCTURE
Gold continues to hold above EMA200 — now 4 consecutive days. LONG/Above/Bullish at $4,568 during London session.
The rally from $4,350 to $4,625 earlier today was strong, with bullish BoS stacking all the way up. But the pullback from $4,625 to $4,568 is worth watching — an MSS candidate (↓) has appeared on the right side of the chart, meaning a bearish reversal would trigger if price breaks below the recent swing low.
EMA200 (cyan ~$4,515) is now acting as support for the fi
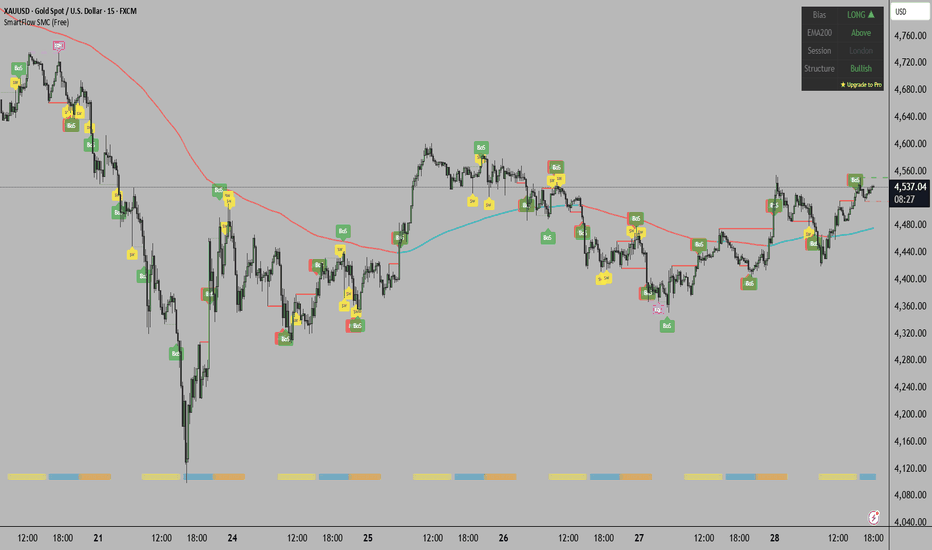
XAUUSD: EMA200 Reclaimed — First Time in 3 Weeks. Is Crash Over?This analysis uses SmartFlow SMC (Free) — auto-detects BoS, MSS, EQH/EQL, BSL/SSL, and Sweeps. No repainting. Community Scripts. Pro version with FVG, OB, OTE, Confluence, and Alerts coming soon.
═══════════════════════════════════════
█ THE MILESTONE
For the first time since the crash began on Mar 13, SmartFlow is showing:
Bias: LONG ▲
EMA200: Above
Structure: Bullish
All three aligned bullish. This hasn't happened in three weeks .
Price is at $4,535, sitting above both
XAUUSD: Bullish Structure at EMA200 — The Retest That Matters
This analysis uses SmartFlow SMC (Free) — auto-detects BoS, MSS, EQH/EQL, BSL/SSL, and Sweeps. No repainting. Community Scripts. Pro version coming soon.
═══════════════════════════════════════
█ STRUCTURE
Something has shifted. SmartFlow shows LONG/Bullish for the first time in days, with price at $4,445 — right at the EMA200 convergence zone.
Price bounced from $4,360 with bullish BoS stacking up. The EMA200 lines (cyan ~$4,480, red ~$4,450) are converging and price is sitting r
NATGATE - 8 RECORD SESSION LOWS ?NATGATE : CURRENT PRICE : RM1.00 - RM1.02
NATGATE has been in a corrective phase and recently printed an 8-session low, which often signals selling exhaustion and opens the door for a technical rebound. (The record session topic is discussed by STEVE NISON in his book - BEYOND CANDLESTICK , PAGE 121 - 127)
A bullish piercing line appeared in Friday’s session, where buyers pushed price well into the prior bearish candle’s body. Stochastic oscillator is currently in the oversold zone, signallin
FTAI - Second Opportunity as Trend Structure HoldsFTAI - CURRENT PRICE : 285.75
After the prior technical buy call reached both targets, FTAI is now forming another technically constructive setup worth monitoring. For reference, my previous technical buy call, which successfully hit both targets, is attached in link section.
After the breakout on 30 December 2025, price advanced strongly, followed by a pullback that has reached the 38.2% Fibonacci retracement, which is typical and healthy in strong trends. Price continues to hold above th
S&P500 Is at a Critical Support|The Week’s Direction Starts HereToday, I want to analyze the S&P 500 index( FX:SPX500 ) at the beginning of the new week, because it’s one of the key indices in financial markets. Several assets, especially in the crypto market like Bitcoin ( BINANCE:BTCUSDT ), show strong correlation with it—particularly when the S&P makes sharp moves. So, for analyzing crypto markets, it’s better to have an S&P 500 analysis too. Stay with me.
The S&P 500 is currently moving near a support zone($6,877-$6,837) and support lines. Last week, t
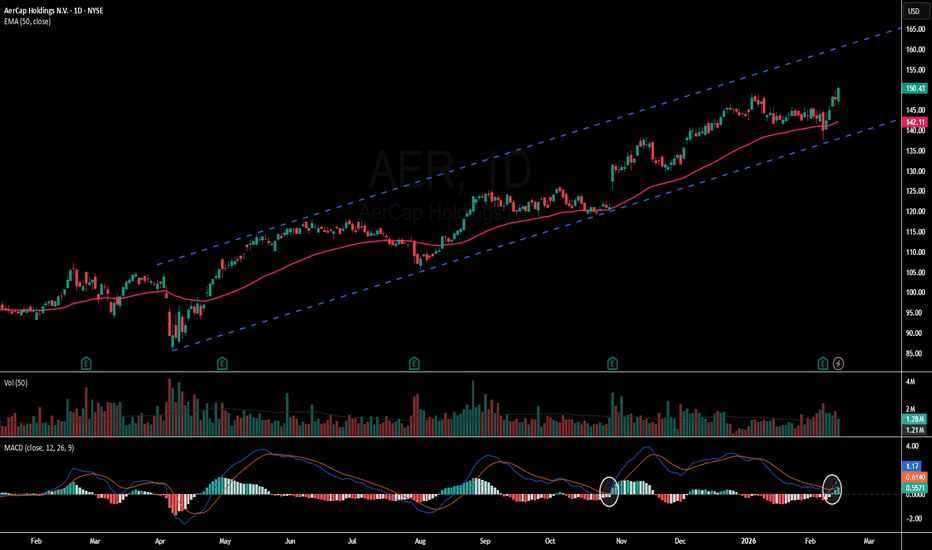
AER - Ascending Channel & MACD Signal Point to Further UpsideAER - CURRENT PRICE : 150.43
AerCap Holdings N.V. (AER) is currently trading at all-time high levels, which reflects strong bullish momentum and continued demand from buyers. When a stock reaches new highs, it enters a price discovery phase with no historical resistance above, often signaling sustained upward strength.
Technically, price is moving within a well-defined ascending channel , forming higher highs and higher lows — a classic sign of a healthy uptrend. In addition, the stock is t
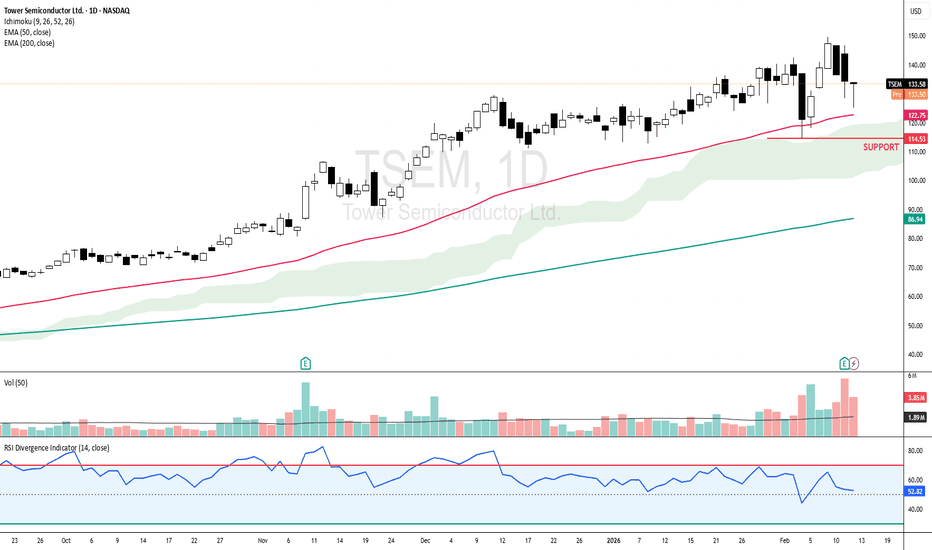
TSEM - Hammer at EMA 50 Confirms Bullish Trend ContinuationTSEM - CURRENT PRICE : 133.58
📈 TSEM – Technical Buy Call (Hammer at EMA 50)
Tower Semiconductor (TSEM) remains in a strong uptrend, with price holding above EMA 200 (long-term bullish) and above EMA 50 (medium-term bullish). The recent hammer candle near EMA 50 signals strong buying interest and rejection of lower prices. Importantly, price has been staying above the Ichimoku Cloud since May 2025, confirming a sustained bullish trend. RSI remains above 50, supporting positive momentum.
Ac