SRF – STWP Equity Snapshot📊 SRF – STWP Equity Snapshot
Ticker: NSE: SRF
Sector: Specialty Chemicals / Industrial Materials
CMP: 2,626.30 ▲ (+5.53% | 12 Mar 2026)
Learning Rating: ⭐⭐⭐⭐⭐ (High-Conviction Recovery Attempt)
Chart Pattern Observed: Bullish Engulfing After Downtrend
Candlestick Context: Strong Bullish Expansion Candle with Exceptional Participation
SRF has been trading under corrective pressure for several weeks, forming a sequence of lower highs and lower lows that defined the broader downtrend structure. The latest price action, however, indicates a strong reversal attempt supported by a bullish engulfing formation emerging after the decline. Such formations often signal a shift in short-term market control as buyers step in aggressively after extended weakness.
RSI is currently positioned near 46.02, reflecting recovery from weaker momentum zones but still below strong bullish territory. This suggests that the market is transitioning from corrective conditions toward stabilisation rather than entering an overextended rally. MACD is beginning to stabilise after a prolonged negative phase, indicating that downside momentum may be fading while buyers attempt to rebuild directional strength.
From a structural perspective, price is now approaching a resistance band between 2,693 and 2,760, which represents the nearest supply cluster created during the earlier decline. Acceptance above this band would strengthen the probability of a broader recovery phase. Until that acceptance occurs, the current move should be interpreted as a recovery rally within a developing structure rather than a confirmed trend reversal.
Volume Analysis
Current volume is significantly elevated with relative volume around 3.28 times the recent average. The bullish expansion candle is supported by exceptional participation, suggesting that institutional activity may be present in the move. Such high participation strengthens the credibility of the reversal attempt, although continuation strength will depend on whether this volume expansion sustains near resistance levels.
Key Levels – Daily Timeframe
Primary support areas are positioned near 2,503, followed by 2,379 and 2,312. On the upside, resistance zones are located around 2,693, 2,760 and 2,883. These levels represent prior reaction points where price has historically paused or reversed and therefore serve as structural decision zones.
Structure Read – What Matters Now
The most notable development is the strong bullish engulfing candle emerging after a prolonged corrective phase. The immediate focus now shifts to whether price can achieve sustained acceptance above the 2,693–2,760 resistance cluster. Sustained trade below 2,168 would weaken the broader recovery structure and increase the probability of renewed downward pressure. The key risk lies in resistance rejection after the sharp expansion. The most probable near-term outcome is either controlled consolidation below resistance or continuation if participation remains strong.
Price Reference Framework – Educational View
From an intraday observation perspective, the key reference zone lies around 2,636, with risk invalidation below 2,441. Upside reference zones are positioned near 2,831 and 3,026. These levels are intended purely for studying short-term price behaviour and participation dynamics.
From a swing perspective over the next two to five sessions, the observation zone remains around 2,636, with structural invalidation below 2,168. Upside reference zones extend toward 3,572 and 4,274, becoming relevant only if price sustains above reclaimed resistance areas.
STWP View
Momentum is strengthening while the broader structure transitions from a downtrend into a potential recovery phase. Risk remains elevated due to proximity to resistance and the need for structural confirmation. Volume is high and strongly supportive of the move. Sentiment is bullish with RSI improving and the session recording a 5.53 percent advance.
Final Outlook
Momentum: Strong
Trend: Up
Risk: High
Volume: High
📘 Learning Note
A bullish engulfing candle after a decline signals the beginning of a structural test. Confirmation occurs only when price sustains above resistance zones where earlier selling emerged.
⚠️ Disclaimer
This analysis is generated strictly for educational and analytical purposes only. All option structures, metrics, scores, interpretations, PCR, Max Pain levels, and volatility commentary are model-based observations derived from uploaded data. This does not constitute investment advice, trading advice, or a recommendation to buy or sell any security or derivative instrument. Options trading involves substantial risk and may not be suitable for all participants. Readers are advised to exercise independent judgment and consult a SEBI-registered financial advisor before making any trading or investment decisions. STWP assumes no responsibility for any financial loss arising from the use of this analysis.
STWP Option Chain Analysis – SRF
Here is a quick options-based observation for SRF.
From the current options activity, an important support area appears near 2580, while resistance is visible around 2700. Liquidity concentration is strongest near 2620, which often becomes a zone where price spends time as traders adjust positions.
Call-side positioning is gradually building near the 2700 strike, suggesting that this level may act as a near-term ceiling unless stronger momentum emerges. On the put side, liquidity is visible around 2580, indicating that this level may provide defensive support.
Based on the current option structure, the visible positioning band appears to be between 2580 and 2700, creating an approximate range width of about 120 points. Using this structure as a reference, the estimated intraday movement expectation is roughly around ±48 points from the ATM level.
This places the approximate upper activity zone near 2668, while the lower activity zone appears near 2572. Current gamma positioning suggests range-bound behaviour as dealer hedging activity may keep price rotating around key strikes.
Options pressure currently shows call pressure near 45 percent and put pressure near 55 percent, indicating relatively stronger put-side positioning and supportive market structure.
Build-Up Signal: Long Build-up
Key Liquidity Strikes:
Best CE Liquidity Strike: 2640
Best PE Liquidity Strike: 2620
Liquidity Vacuum Zones: 2600, where price may move faster through the level.
Current positioning does not show a strong dealer trap structure.
If price manages to move above 2800, it may indicate strengthening bullish momentum. On the other hand, if price moves below 2480, downside pressure may begin to increase.
Overall, the present options structure suggests that price may continue rotating between 2580 and 2700, with 2620 acting as a short-term liquidity magnet while market participants adjust positions.
Important Note
This information is shared strictly for educational and analytical purposes based on publicly available options chain data. It is not investment advice, not a trading recommendation, and not a buy or sell signal. Please consult a SEBI-registered financial advisor before making any trading or investment decisions.
– STWP
Engulfing Candle
Havells Trendline BreakHavells has given a breakdown of a trendline on the daily timeframe with a bearish engulfing candle. After a good upside this breakdown can be seen as a reversal trade. One can look for an short entry at-
Entry- 1416-1420
SL- 1450
Target 1380, 1360 and swing traders can even look for targets of the gap which is seen on the chart.
Follow for more such learnings and analysis.
Disclaimer- This is just for educational purpose.
JAI SHREE RAM.
Bullish Engulfing Pattern — The Psychology of ReversalBullish Engulfing Pattern
Hello everyone! Today, we're diving into one of the most powerful reversal patterns in technical analysis — the Bullish Engulfing pattern. It's not just a combination of two candles; it reflects the psychological state of the market and the moment when the balance of power shifts from sellers to buyers.
➡️ What Does It Look Like?
This is a two-candlestick pattern:
First Candle — Bearish (Red/Black): Reflects the temporary dominance of sellers, continuing the downward move.
Second Candle — Bullish (Green/White): Its body completely engulfs the body of the previous red candle.
Important: It's the body that gets engulfed. The shadows (wicks) can extend beyond the body. The larger the second candle's body relative to the first, the stronger the signal.
➡️ Where Does It Appear?
The pattern forms at the end of a downtrend or at a significant support level. It's an early warning that a trend reversal might be coming.
➡️ Market Psychology: What's Happening Inside?
The market is moving down. The first (red) candle closes lower than it opened — sellers seem in control, bears are confident.
Then, on the next candle, something unexpected happens. Price opens even lower than the previous close (perhaps with a gap). It looks like the bears are about to crush the market again. But instead, price sharply reverses upwards and closes above the first candle's open.
This tells us:
The bears exhausted their momentum and couldn't hold prices at the lows.
Bulls aggressively stepped in and completely seized control, buying up all the sellers' positions.
➡️ Key Rules for Identification:
Trend: A clear downtrend must precede the pattern. The signal is weaker in a sideways market.
Colors: First candle is bearish; second is bullish.
Engulfing: The body of the second candle must completely cover the body of the first.
Size: The second candle is noticeably larger than the first. The bigger the contrast, the stronger the signal.
Shadows: They are allowed, but shorter shadows indicate more decisive engulfing.
⚠️ CRITICAL: Context and Confirmation are Key
The Bullish Engulfing pattern is NOT a standalone buy signal. It requires additional confirmation on the chart. This filter protects you from false entries.
The pattern gains maximum strength when it appears:
✅ At a Support Level: This is mandatory. The pattern should form at a significant support level (historical level, demand zone, mirror level).
✅ Near an Order Block (OB): The signal is especially strong if the bullish engulfing candle originates from a zone of institutional interest.
✅ With a Fair Value Gap (FVG): An unfilled FVG near the pattern increases the probability of a reversal.
✅ With a Structure Break: It's even better if the pattern simultaneously breaks a trendline or a significant level.
✅ With Volume: Higher-than-average volume on the second candle confirms buyer aggression.
✅ On Higher Timeframes: The higher the timeframe, the stronger the reversal signal. On daily (D1) or weekly (W1) charts, it's a major alert. On a 5-minute chart, it's just short-term noise.
❌ If a Bullish Engulfing pattern appears in the middle of random, chaotic movement with no connection to key levels — its value is minimal. Do not trade it.
➡️ Trading Plan: How to Use It
Do NOT enter immediately when the second candle closes. Always wait for confirmation.
Entry Point:
On a retest of the level broken by the bullish candle (its close or high level now acting as support).
Or after price firmly closes above a nearby resistance level.
Stop-Loss: Place it below the low of the second candle (or below its lower wick).
Take Profit (Target): The nearest resistance level above, or a target based on your risk/reward ratio (aim for at least 1:2).
➡️ Key Takeaways:
Essence: A bullish reversal signal showing a shift in market balance.
Main Condition: Second candle's body fully engulfs the first's body + mandatory location at a support level.
Golden Rule: Higher timeframe = stronger signal.
Discipline: This pattern requires confirmation. It doesn't work in a vacuum.
SOLARINDS – STWP Equity Snapshot📊 SOLARINDS – STWP Equity Snapshot
Ticker: NSE: SOLARINDS
Sector: Industrial Explosives / Defence Manufacturing
CMP: 13,989.00 ▲ (+3.59% | 03 Mar 2026)
Learning Rating: ⭐⭐⭐⭐☆ (Range Compression Near Upper Band)
Chart Pattern Observed: Bullish Engulfing Within Broad Consolidation
Candlestick Context: Strong Bullish Expansion Candle with Rising Participation
SOLARINDS continues to trade within a broad consolidation structure after reacting from the strong demand zone near 11,600–11,800. The recent price action shows a bullish engulfing candle forming near the upper half of the range, indicating renewed buying interest as price attempts to push toward the swing high zone near 14,900–15,000. While the broader trend remains constructive, the structure is still range-based until a decisive breakout above prior swing highs is achieved.
RSI is positioned near 61.8, reflecting strengthening momentum without entering extreme overbought conditions. This suggests healthy bullish participation rather than euphoric extension. MACD remains positively aligned, supporting continuation bias in the short term. From a CPR perspective, price is holding within a bullish zone with projected levels shifting upward, indicating developing structure rather than breakdown risk. However, the immediate supply cluster between 14,351 and 14,713 remains critical. Acceptance above this band would increase the probability of a structural breakout, while rejection may result in continued consolidation inside the broader range.
Volume Analysis
Current volume is running above recent average participation, supporting the bullish expansion candle. The move is backed by credible activity rather than passive drift. Continuation strength will depend on whether volume expands further as price approaches the upper resistance cluster. Sustained participation near resistance improves breakout probability; contraction may lead to another pullback within range.
Key Levels – Daily Timeframe
Primary support areas are positioned near 13,363, followed by 12,737 and 12,375. On the upside, resistance zones are located around 14,351, 14,713, and 15,339. These levels represent prior reaction zones and define the structural boundaries of the current consolidation.
Structure Read – What Matters Now
The key observation is the bullish engulfing formation emerging within a tightening range structure. The focus now shifts to whether price can achieve sustained acceptance above the 14,351–14,713 resistance cluster. Failure to hold above 13,363 would weaken the immediate bullish structure and increase the probability of range continuation. The primary risk lies in resistance rejection near prior swing highs. The most probable near-term path is a breakout attempt toward the swing high zone, followed by either expansion on volume or controlled consolidation.
Price Reference Framework – Educational View
From an intraday perspective, the observation zone lies around 13,990, with risk invalidation below 13,594. Upside reference zones are positioned near 14,351 and 14,713. These levels are intended solely for studying short-term price behaviour and participation.
From a swing perspective over the next two to five sessions, the observation zone remains around 13,990, with structural invalidation below 12,737. Upside reference zones extend toward 15,339 and higher structure-dependent projections, becoming relevant only if price sustains above reclaimed resistance.
STWP View
Momentum is strong within a developing structure, while the broader trend remains classified as range movement transitioning toward potential breakout. Risk remains elevated due to proximity to upper resistance. Volume is supportive and constructive. Sentiment is bullish, with RSI strengthening and price advancing 3.59 percent in the session.
Final Outlook
Momentum: Strong
Trend: Range to Breakout Attempt
Risk: High
Volume: Moderate to High
📘 Learning Note
Breakouts are validated by acceptance and sustained participation above resistance. A strong candle inside a range is preparation; confirmation comes only after structure shifts.
⚠️ Disclaimer
This post is intended solely for educational and informational purposes. It does not constitute investment advice, a recommendation, or a solicitation to buy or sell any security. Market investments are subject to risk. Please consult a SEBI-registered financial advisor before making any investment decisions. STWP is not responsible for actions taken based on this analysis.
Did this help you read the chart better?
Boost | Comment | Share with a learner
Follow STWP for clean chart-reading insights
Stay Calm. Stay Clean. Trade With Patience.
DIXON – STWP Equity Snapshot📊 DIXON – STWP Equity Snapshot
Ticker: NSE: DIXON
Sector: Electronics Manufacturing Services
CMP: 10,528.00 ▲ (+4.07% | 27 Feb 2026)
Learning Rating: ⭐⭐⭐⭐☆ (Reversal Attempt Within Broader Downtrend)
Chart Pattern Observed: Double Bottom with Bullish Engulfing Near Support
Candlestick Context: Strong Bullish Expansion Candle with High Participation
DIXON has been in a sustained corrective decline, forming a clear sequence of lower highs and lower lows over the past several months. The recent price action, however, signals a potential structural shift as the stock attempts to form a double bottom near the 9,800–10,000 demand region. The emergence of a bullish engulfing candle at this zone, supported by strong participation, indicates that buyers are attempting to absorb supply after an extended downtrend.
RSI is positioned near 40.54, reflecting recovery from oversold conditions without entering overbought territory. This suggests improving momentum rather than confirmed bullish dominance. MACD is showing early stabilisation, indicating that downside momentum is cooling, though a confirmed trend reversal will require sustained follow-through. Structurally, price remains below the broader resistance band near 11,175–11,868, and until that supply zone is reclaimed with acceptance, the overall structure remains range-to-recovery rather than confirmed trend reversal.
From a CPR perspective, price is attempting to stabilise around the pivot region after prolonged weakness. The projected CPR remains relatively wide, which typically aligns with volatility expansion. Acceptance above immediate resistance levels would strengthen the reversal case, while rejection could result in continued range-bound behaviour within the broader corrective structure.
Volume Analysis
Current volume is significantly elevated, with relative volume at 2.62 times average participation. The bullish expansion is supported by strong activity, indicating genuine participation rather than passive bounce behaviour. High volume near structural support enhances the credibility of the reversal attempt. Continuation strength, however, will depend on whether participation remains strong as price approaches higher resistance zones.
Key Levels – Daily Timeframe
Primary support areas are positioned near 10,020, followed by 9,876 and 9,667. On the upside, resistance zones are located around 10,737, 10,946, and 11,172. These levels represent prior reaction points and serve as structural reference areas for continuation or rejection.
Structure Read – What Matters Now
The key structural development is the formation of a potential double bottom accompanied by a bullish engulfing candle on high volume. The immediate focus is on whether price can achieve acceptance above the 10,737–10,946 resistance cluster. Sustained trade below 9,287 would weaken the recovery structure and increase the probability of trend continuation to the downside. The primary risk lies in failure near resistance, which could convert the current move into a temporary relief rally within a broader downtrend. The most probable near-term path is range expansion attempt toward overhead supply, followed by either acceptance or consolidation.
Price Reference Framework – Educational View
From an intraday perspective, the observation zone lies around 10,620, with risk invalidation below 10,064. Upside reference zones are positioned near 11,175 and 11,730. These levels are intended solely for studying short-term price behaviour and structural interaction.
From a swing perspective over the next two to five sessions, the observation zone remains around 10,620, with structural invalidation below 9,287. Upside reference zones extend toward 13,285 and 15,285, and become relevant only if price sustains above reclaimed resistance levels.
STWP View
Momentum is strong in the short term, but the broader trend remains range-bound within a developing recovery phase. Risk is elevated due to proximity to overhead resistance and prior downtrend context. Volume is high and supportive of the current reversal attempt. Sentiment is neutral, RSI stands at 40.54 reflecting improving momentum, and the session registered a 4.07 percent advance.
Final Outlook
Momentum: Strong
Trend: Range
Risk: High
Volume: High
📘 Learning Note
Reversal structures gain strength when high participation aligns with demand zones. Confirmation comes from acceptance above supply, not from the first bullish candle.
⚠️ Disclaimer
This post is intended solely for educational and informational purposes. It does not constitute investment advice, a recommendation, or a solicitation to buy or sell any security. Market investments are subject to risk. Please consult a SEBI-registered financial advisor before making any investment decisions. STWP is not responsible for actions taken based on this analysis.
💬Did this help you read the chart better?
🔼 Boost | ✍️ Comment | 🔁 Share with a learner
👉 Follow STWP for clean chart-reading insights
Stay Calm. Stay Clean. Trade With Patience.
S&P500 Is at a Critical Support|The Week’s Direction Starts HereToday, I want to analyze the S&P 500 index( FX:SPX500 ) at the beginning of the new week, because it’s one of the key indices in financial markets. Several assets, especially in the crypto market like Bitcoin ( BINANCE:BTCUSDT ), show strong correlation with it—particularly when the S&P makes sharp moves. So, for analyzing crypto markets, it’s better to have an S&P 500 analysis too. Stay with me.
The S&P 500 is currently moving near a support zone($6,877-$6,837) and support lines. Last week, the monthly pivot point($6,917.5) acted as a good resistance level for this index.
From a classical technical analysis perspective, especially candlestick patterns, on the 4-hour timeframe, we can see bullish reversal patterns: Bullish Engulfing Candlestick Pattern_Morning Star Candlestick Pattern.
From an Elliott Wave theory perspective, it seems the S&P 500 has completed five main impulsive waves on higher timeframes, so we might NOT see new all-time highs. On the 4-hour chart, it looks like we’re in a short-term downward trend to complete wave C of a zigzag correction(ABC/5-3-5).
I expect the S&P 500 index, at least in the short term, to attack the monthly pivot point. If that breaks, the next target could be $6,937.
First Target: Monthly pivot point($6,917.5)
Second Target: $6,937
Third Target: Resistance lines
Stop Loss(SL): $6,832(Worst)
Points may shift as the market evolves
What’s your outlook on the S&P 500 for the week? Should we expect a bullish continuation or a drop in the U.S. stock market?
Note: In case of escalating Middle East tensions in the coming days, we might see a sudden drop in the S&P 500. Thus, managing capital is crucial, especially these days when markets fluctuate more on news and statements.
💡 Please respect each other's opinions and express agreement or disagreement politely.
📌 S&P 500 Index Analyze (SPX500USD), 4-hour time frame.
🛑 Always set a Stop Loss(SL) for every position you open.
✅ This is just my idea; I’d love to see your thoughts too!
🔥 If you find it helpful, please BOOST this post and share it with your friends.
Critical Macro Signs Seen on SPOT, warrant attentionSpotify has been a fan favorite for the last few years. I mean who wouldn't fall in love with it. It has had roughly 850% gains since Feb 2023.
And so its recent downtrend requires attention. Traders and investors alike are wondering if this is buy the Dip situation with many probably been doing so. But you have to take the time and ask yourself am i acting on emotion such as Fear of Missing Out or am i acting on evidence, actual signs that indicate it really is Buy the Dip situ.
Many people from hedge fund guys to influencers will say things, signals will be called. But the attention should be put on the facts in the charts. We should consider what price action is telling us and if there are clues in certain indicators or not.
Since we have been in a Uptrend for roughly 2 - 3 years, we have to consider SPOT to have experienced a Bull run. With recent downtrend, we have to then consider whether or not the Bull trend is INTACT or if its being invalidated or in other words if the current downtrend shows signs that Trend is reversing. If signs of reversal are present it may not be a Buy the dip situation.
IN trading and Investing, we must remove Emotion, Humble ourselves and consider all scenarios at all times.
Okay so we will look into the Macro picture of price action. Ill start with the 1 Month timeframe. Note that each candle is 1 Months average of opening/closing price. Macro analysis is a powerful tool especially to determine large picture, long duration trends like Bull runs or bear markets.
June 2025 we reached a high of roughly $770. But the Month after (July) We experienced extreme sell off indicated by the Engulfing Bearish candle. Which on the 1 Month is an alarming sign. (This could be the top)
Followed by 3 Months of attempts to get back on track of the trend. Which met with continued SELL pressure indicated by the Large Upper wicks in August & Sept.
Then from October we continued to sell off. Fast forward to this current month of January. We are on the verge of printing another Large Body Bearish Candle. Which warrant caution.
Candle bodies and its size indicate the strength of that candles move and may even help determine price moves in the future. Incase of Monthly candles, a large candle print can make impacting future moves more probable. Something to consider.
We are also in the process of breaking down below a Horizontal Support line where Jan to March 2025 we maintained Support or showed Buy pressure on.
This may be a low that could invalidate our Bull run.
Our current Monthly candle is also in a crucial Support zone depicted by yellow zone.
There are 2 Bull Support Trend lines depicted by green lines. Where we can attempt to test Support. We are currently doing so on the first line.
If we fail to hold here, we would test Support at the lower order of the Yellow zone.
If we fail to hold here, we'd test Support at the Lower green line.
And if this fails we would attempt Support at the Resistance Turned Support line at around $300.00.
We have 2 days in the Month. If we can have Buy pressure come in and have this months candle wick back above the Support line we are breaking. That would be a solid sign for bullish case. But dont think its a probable case.
We would need to see signs of confirming Support if we are too continue the Bull run.
Till then SPOT warrants caution and in my opinion definitely not a Buy the Dip situation at this moment.
We need to show patience in the markets if we want to be successful and not be on the end of a losing position.
Follow me and continue to observe SPOT. Look to more updates to the analysis.
EURJPY bearish expectations from here
OANDA:EURJPY we can see BEARISH ENGULFING candle, after bearish engulfing looks like coming descending triangle. We are have constant bullish trend here long period and here after todays events expecting to see point of revers.
SUP zone: 182.500
RES zone: 180.300, 178.900
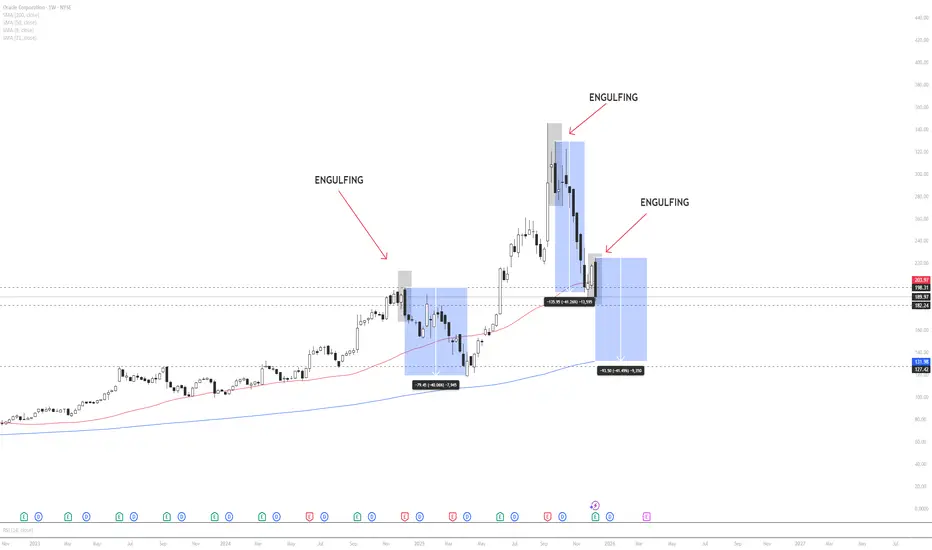
ORCL – Weekly Technical & Historical AnalysisOracle is currently trading in a weekly consolidation (flat) zone, indicating a neutral market structure. However, price has closed below the 50-period moving average , which often signals a shift in medium-term momentum.
A key technical development is the appearance of a weekly bearish engulfing candle, a pattern that historically precedes sharp downside moves in ORCL.
When analyzing previous occurrences of similar engulfing patterns, price declined by approximately 40% in the first instance and showed a nearly identical drawdown in the second instance. If historical behavior repeats , price may continue lower toward the 200-period moving average and the major support zone marked on the chart, which aligns closely with a projected ~40% correction.
Markets often exhibit recurring behavioral patterns, especially in higher timeframes. For this reason, downside risk remains elevated unless price reclaims the 50 MA and invalidates the engulfing structure.
This analysis is based on historical probability and technical structure and is not financial advice. Traders should manage risk accordingly.
FireHoseReel | Engulfing Candlestick Pattern (Crypto Version)🔥 Welcome FireHoseReel !
Let’s dive into the Engulfing Candlestick Pattern.
✔️ Bearish Engulfing – Basics
The Bearish Engulfing is a two-candlestick reversal pattern.
The first candle is bullish, and the second is a larger bearish candle that fully engulfs the first candle’s body and closes below its low.
Since crypto rarely has gaps, the key condition is that the second body completely covers the first body.
Shadows are not significant.
This pattern is most reliable after a weakening uptrend.
🎯 Bearish Engulfing – Psychology
This pattern shows a strong bearish shift.
Buyers push price upward at first, but the second candle proves sellers have taken full control, dragging price down and even breaking the previous candle’s low.
It signals momentum shifting from bulls to bears.
🧮 Bearish Engulfing – Setup & Levels
• Trigger: Break below the low of the second candle.
• Confirmation: A close below the trigger.
• Stoploss: Above the high of the second candle or whole structure.
• Buy-stop entry: Only if the main trend remains strongly bullish (rare in crypto).
✔️ Bullish Engulfing – Basics
The Bullish Engulfing is a two-candlestick reversal.
The first candle is bearish, and the second is a larger bullish candle that fully engulfs the first body and closes above its high.
In crypto, the key factor is that the second bullish body fully covers the first bearish body.
It works best after a downtrend or capitulation phase.
🎯 Bullish Engulfing – Psychology
This pattern indicates a strong bullish reversal.
Sellers control the first candle, but buyers return aggressively on the second candle, overpowering them and closing above the previous high.
It signals momentum shifting from bears to bulls.
🧮 Bullish Engulfing – Setup & Levels
• Trigger: Break above the high of the second candle.
• Confirmation: A close above the trigger.
• Stoploss: Below the low of the second candle or structure.
• Sell-stop entry: Only in strong downtrends and rarely recommended.
🛞 Risk Management & Disclaimer
Please remember to always use proper risk management and position sizing. Nothing in this analysis is financial advice. The market can change quickly, so always trade based on your own strategy, research, and risk tolerance. You are fully responsible for your own trades.
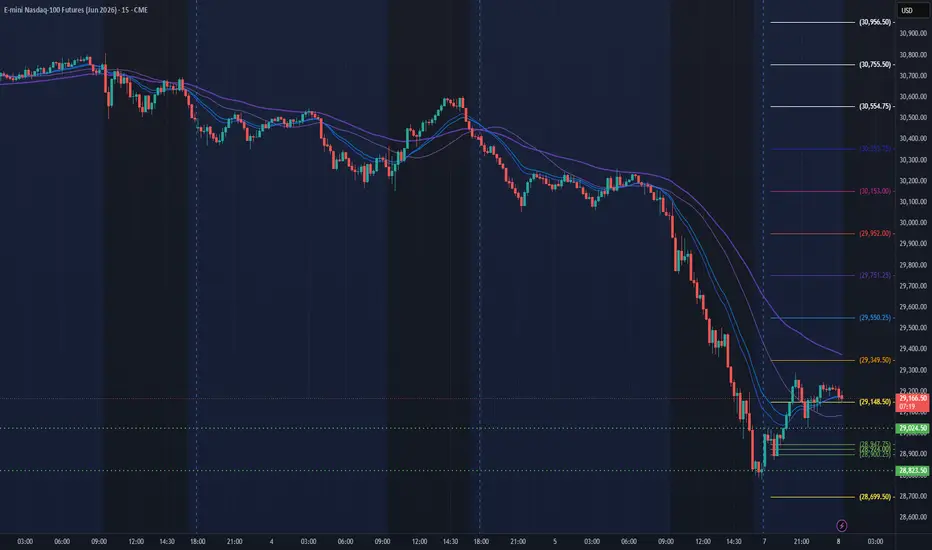
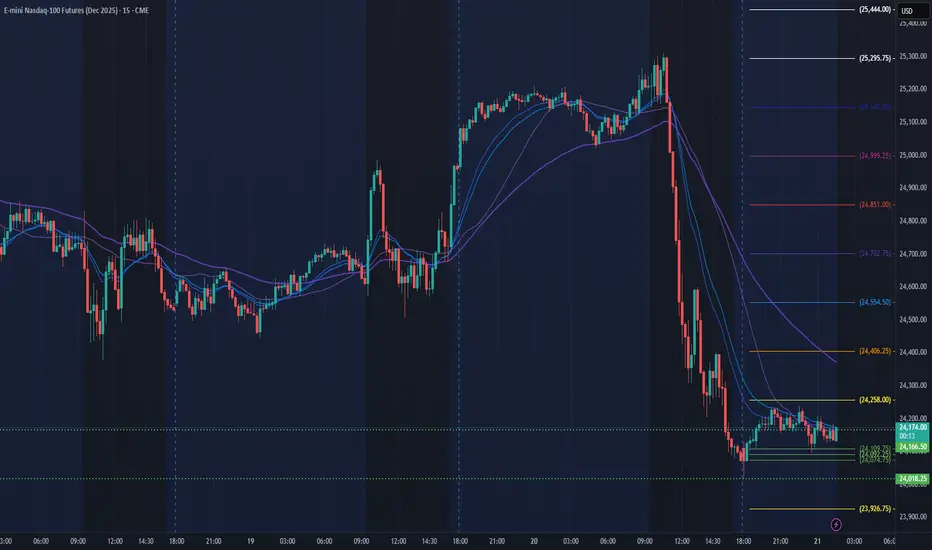
NQ Power Range Report with FIB Ext - 11/21/2025 SessionCME_MINI:NQZ2025
- PR High: 24166.25
- PR Low: 24018.00
- NZ Spread: 331.0
Key scheduled economic events:
09:45 | S&P Global Manufacturing PMI
- S&P Global Services PMI
Session Open Stats (As of 12:35 AM)
- Session Open ATR: 525.13
- Volume: 66K
- Open Int: 301K
- Trend Grade: Long
- From BA ATH: -8.4% (Rounded)
Key Levels (Rounded - Think of these as ranges)
- Long: 26636
- Mid: 25410
- Short: 24039
Keep in mind this is not speculation or a prediction. Only a report of the Power Range with Fib extensions for target hunting. Do your DD! You determine your risk tolerance. You are fully capable of making your own decisions.
BA: Back Adjusted
BuZ/BeZ: Bull Zone / Bear Zone
NZ: Neutral Zone
$SOL Bullish Engulfing Weekly CloseSolana is looking good here 👍🏽
Reclaimed the 50WMA and closed above the 50% Gann Level.
Note the Bullish Engulfing candle for the Weekly Close.
However CRYPTOCAP:SOL Still trading within the DANGER ZONE ⚠️
Need these next couple weeks to close outside of this POI.
You can see the Liberation Day lower trendline still remains intact for support and we had the Bullish Cross a few weeks ago on the 20 / 50 WMA 🤓
Salik Stock Reversal Alert-A Hidden Gem in Dubai’s Stock Market!Hello Traders!
Today’s analysis is on Salik Company PJSC (DFM), one of Dubai’s most watched stocks. UAE markets are full of hidden opportunities, and this chart highlights one of them. After forming a strong Rectangle Pattern for months, the stock finally gave a clean Breakout , followed by a Bullish Engulfing retest candle , a classic sign of buyers returning with strength.
Why this setup is special?
Rectangle pattern breakout after long consolidation shows trend resumption potential.
Bullish engulfing pattern adds confirmation of renewed momentum.
Multiple timeframe structure supports higher targets with low downside risk.
Levels to Track:
The best entry zone remains around 5.80–5.90 AED , where strong support and bullish engulfing confirmation align. The first short-term target is placed at 6.25 AED , followed by a medium-term target near 6.60 AED , and a positional level of 6.99 AED . Long-term investors can aim for the major holding target around 8.00 AED . A stop loss below 5.37 AED should be maintained to protect positions.
If you want to catch these kinds of early setups before they explode, make sure you follow closely, (Analysis By @TraderRahulPal ). More analysis & educational content is shared regularly on my profile. Sometimes one strong setup can shift your entire month’s momentum. If this helped you, don’t forget to like and follow for regular updates.
Disclaimer:
This analysis is for educational purposes only and should not be taken as financial advice. Please do your own research or consult your financial advisor before investing.
$GOLD Bearish Engulfing on Daily - Rotation to $BTC Incoming!MASSIVE BEARISH ENGULFING FORMING ON THE TVC:GOLD DAILY CHART.
Down ~7% just on the day alone.
~$2 TRILLION has been wiped out on its market cap,
the equivalent of Bitcoin’s entire MC.
We can see the rotation into CRYPTOCAP:BTC in real-time here.
If GOLD Closes below the DANGER ZONE,
it’s game-over for everyone’s favorite pet rock 🪙
FRA40 (CAC 40 Index) – 4H Short Setup AnalysisPrice has pushed into a strong supply zone around 8,240–8,280, which has acted as a previous area of rejection. The market is currently showing exhaustion signs in that region, with consecutive wicks rejecting higher prices — suggesting potential bearish momentum buildup.
Market Structure:
The overall structure on the 4H timeframe remains bullish, but price is currently overextended after multiple impulsive legs. The most recent push into this supply zone shows signs of distribution, making it a high-probability area for a potential short-term correction before continuation.
Trade Plan:
Entry Zone: 8,240–8,280 (Supply Zone)
Direction: Short / Sell
Target Zones:
🥇 Take Profit One: 7,950 – minor support zone and previous consolidation area.
🥈 Take Profit Two: 7,850 – aligns with structural support from previous price accumulation.
🥉 Take Profit Three: 7,580 – major demand zone and potential swing low region.
Invalidation (Stop Loss): Above 8,300 – a clean break and close above this level would invalidate the short bias, indicating bullish continuation.
Confluence Factors:
✅ Strong supply zone rejection
✅ Multiple top wicks showing seller pressure
✅ Bearish divergence likely forming (if confirmed on RSI or MACD)
✅ Overextended bullish leg due for a retracement
Trade Bias:
🔻 Bearish (Short-term correction expected)
Risk Management:
Always use proper position sizing and risk management. A tight stop above the supply zone (around 8,300) keeps this setup favorable in terms of risk-to-reward.
💭 My Thoughts on Your Setup:
This idea is well-structured and makes sense technically. You’re trading directly from a premium zone (the upper range of a swing), with clear targets based on structure — that’s a solid approach for 4H swing trading.
Here’s what strengthens your setup:
The supply zone is clean and tested only once — still fresh.
You’ve placed realistic TP levels, gradually scaling out of the move.
The R:R ratio looks favorable if your stop is just above 8,300.
Potential improvement:
Watch how price reacts around 8,200–8,240 — if momentum shifts heavily bullish with strong 4H closes above 8,280, it’s safer to wait for confirmation before entering short. Otherwise, this is a textbook short setup off supply.
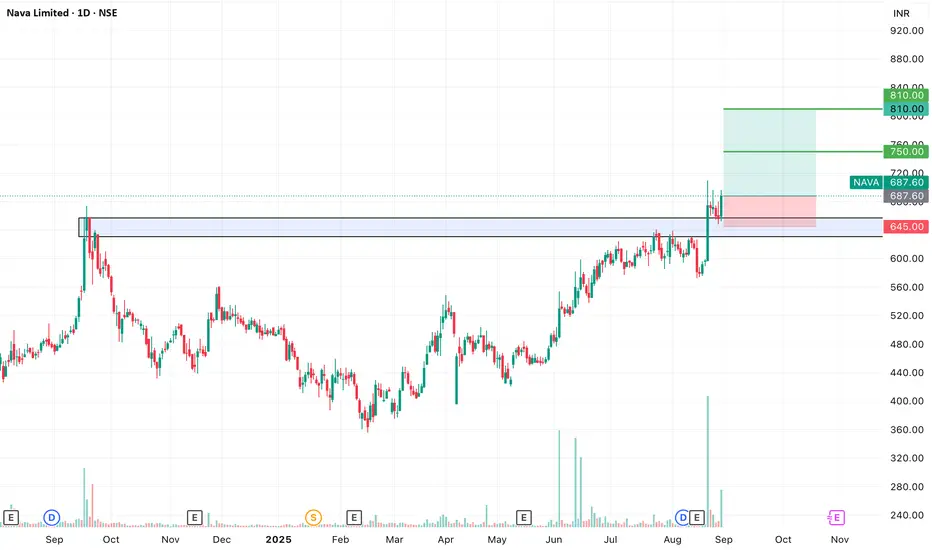
SWING IDEA - NAVA Nava Ltd , a diversified natural resources and energy company, is showing a promising swing opportunity with a breakout backed by strong technical signals.
Reasons are listed below :
Cup and Handle breakout, a strong bullish continuation pattern
Confirmed bullish price action post breakout
Bullish engulfing candle on the daily timeframe
Volume spike, confirming breakout strength
Trading near its 52-week high, showing momentum
Sustaining above 50 & 200 EMA on the daily chart
Target - 750 // 810
Stop loss - daily close below 645
DISCLAIMER -
Decisions to buy, sell, hold or trade in securities, commodities and other investments involve risk and are best made based on the advice of qualified financial professionals. Any trading in securities or other investments involves a risk of substantial losses. The practice of "Day Trading" involves particularly high risks and can cause you to lose substantial sums of money. Before undertaking any trading program, you should consult a qualified financial professional. Please consider carefully whether such trading is suitable for you in light of your financial condition and ability to bear financial risks. Under no circumstances shall we be liable for any loss or damage you or anyone else incurs as a result of any trading or investment activity that you or anyone else engages in based on any information or material you receive through TradingView or our services.
@visionary.growth.insights
Bullish Monthly Candle Expected?4210 Analysis
Closed at 178 (24-06-2025)
Monthly Closing above 173.20 would be
a very +ve Sign.
Crossing & Sustaining 181 on Weekly Basis, may
result in further upside towards 200 - 205.
However, it should not break 136 now; else we
may witness further selling pressure towards 110 - 111.
$BTC Has Entered the DANGER ZONEI warned ya’ll about this ₿itcoin correction on the 15th when that big bearish engulfing candle printed.
CRYPTOCAP:BTC has now officially entered the DANGER ZONE with a break below the 100DMA, 0.236 Fib and previous local high territory.
If PA breaks even further, next stop is the 0.382 Fib ~$105k and possibly the 200DMA ~$101k
CMG - Bullish Engulfing off 200 SMA & Support Zone?(Weekly chart) NYSE: CMG price action went through a series of flush downs into multiple support levels, where market makers likely cleared out stop-losses. At that zone, price formed a bullish engulfing pattern, signaling a potential attempt to rebound and regain momentum.
Price action highlights:
1) Flush down into the previous high level (resistance turned support).
2) Confluence with the 200 SMA on the weekly chart – a strong long-term support line.
3) Extension through the lower Bollinger Band, signaling short-term oversold.
4) Stochastic oversold, hinting at potential reversal.
5) Last week formed a strong bullish engulfing candle at supports.
This setup offers a favorable risk-reward profile — limited downside with strong upside potential.
$BTC Bearish Engulfing Candle AlertGOOD NEWS:
-CME Gap was completely filled.
-PA is still above the 20DMA.
BAD NEWS:
-Very concerning Bearish Engulfing candle on the Daily Close.
-Volume confirms the change in trend.
MY TAKE: I wouldn't be surprised to see the market rally into a low liquidity weekend and dump hard on Monday.