EURUSD - Consolidation ahead of NFP. Bullish trendAfter rallying and reaching a new high of 1.19266, FX:EURUSD entered a consolidation phase amid a weak dollar, which is generally a positive sign for continued growth.
Against the backdrop of a weak dollar, the euro is forming a bullish trend, the likelihood of which continuing is also high, but depends on further news. NFP is being published today.
Local resistance is appearing at 1.19266, relative to which consolidation is forming. The dollar is falling, and against this backdrop, the euro may continue to grow if it breaks the trigger at 1.19266.
Resistance levels: 1.19266, 1.1972
Support levels: 1.1895, 1.1875
Focus on the current consolidation of 1.1895 - 1.1926. Before rising, the market may test the support range, and if the bulls keep the market above the level, the price may form a rally. However, a premature close above 1.19266 will also trigger a continuation of growth to 1.1972 - 1.2025.
Best regards, R. Linda! GOLD - Consolidation before the rally. Focus on 5090FX:XAUUSD is storming 5089 as part of a bullish trend. There is a high probability of a breakthrough, but before that, the market may form a correction. Tomorrow is NFP...
The dollar is falling, and against this backdrop, gold looks like a strong asset in terms of buyer interest.
The projected slowdown in retail sales and weak NFP expectations are supporting expectations of a Fed rate cut. The dollar is under pressure due to rumors of Chinese banks diversifying away from US Treasury bonds. Overall, this supports the bullish trend for the metal.
Core Retail Sales, NFP (a key indicator for the Fed), and CPI will determine the inflation trend and the Fed's future policy
Technically, gold is in a bullish trend, but before rising, it may test the following support levels: 4985, 4902 (sharp long squeeze).
Resistance levels: 5089, 5100, 5250
Support levels: 4985, 4902, 4812
The market continues to approach resistance at 5089, a break of which could trigger a rally to 5250-5400. However, it is possible that a correction could form before the news before growth. Focus on key levels
Best regards, R. Linda!  Long
Long
XRPUSDT - Hunting for liquidity before the fallBINANCE:XRPUSDT looks very weak, losing 69% from its high. As part of the downtrend, the coin may experience sharp local spikes in search of liquidity before falling.
Bitcoin is consolidating below 70K without the ability to break through the key level. The market is stagnating after a sharp decline, which may continue.
After the pullback phase, an intermediate consolidation has formed with a liquidity zone of 1.4625 - 1.4886. Within the downtrend, the market may form a short squeeze in the specified zone, followed by a decline to 1.2845.
The market has confirmed two key levels, 1.4625 and 1.3850, with support tested and a weak reaction. If the market begins to contract towards support, this will only increase the chances of a further decline.
Resistance levels: 1.4625, 1.4885, 1.5300
Support levels: 1.412, 1.385, 1.2845
I do not rule out the possibility of an attempt to break the downward structure and grow, but in the current conditions, any bullish momentum can be quickly sold off. Technically, I have identified an area of interest between 1.4625 and 1.4885. There may be a false breakout, a retest of 1.3850, and a further decline
Best regards, R. Linda!
 Short
Short
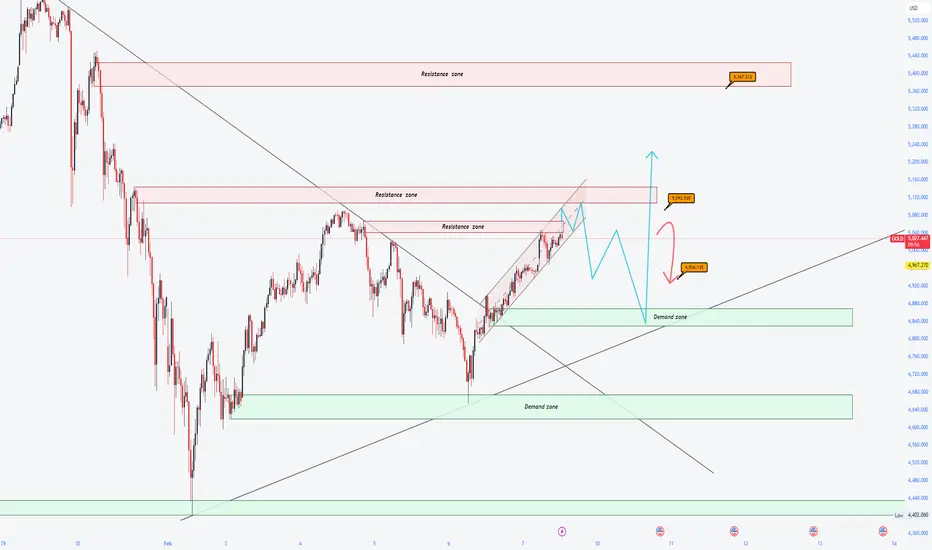
GOLD - Consolidation above 5000. Awaiting NFP...CAPITALCOM:GOLD consolidates above $5,000 in anticipation of key data from the US. Economic data may set the medium-term tone for the market. A long squeeze before the move cannot be ruled out...
Central banks continue to buy metal, expectations of a more dovish Fed policy weaken the dollar. Easing tensions in the Middle East and growing risk appetite in global markets support the gold trend.
Ahead of us are the Employment Report (NFP) on Wednesday and
Inflation Data (CPI) on Friday .
These data will determine further expectations for Fed rates and the direction of the dollar.
Gold is in a state of equilibrium ahead of the release of critical data. A sustained breakout from the current range ($5000-5100) is likely only after the release of US employment and inflation reports, which will clarify the trajectory of the Fed's monetary policy.
Resistance levels: 5047, 5098, 5100
Support levels: 4946, 4902, 4811
The zone of interest and liquidity within the current movement is the 4950-4940 area. There is a possibility that during the transition from the European to the US session, the market will test this area before growing. However, a premature breakout of 5047 and a close above 5050 could trigger a rally to 5150-5250.
Best regards, R. Linda! Long 
EURUSD - Breakthrough of consolidation resistance. Growth?FX:EURUSD is ending its correction. A breakout of resistance and bullish momentum are forming. If the market maintains its current direction, the price could reach 1.197-1.210 in the medium term.
The dollar is falling due to the rise of the Japanese yen after early parliamentary elections, the impact of which may be medium-term.
After the dump, the currency pair formed a consolidation that stopped the local downtrend. The weakening of the dollar triggered a breakout of resistance. The exit from consolidation and the bearish wedge is a fairly strong bullish signal. The market may form a retest of 1.1829 before breaking through 1.1875. If the bulls break through resistance, the medium-term bullish trend may continue.
Resistance levels: 1.1875, 1.1972
Support levels: 171829, 1.1778, 1.1769
After consolidation, the market has entered a distribution phase. Given the current trend, the weak dollar, and the current market phase, there is potential for continued growth.
Best regards, R. Linda! GOLD before Non-Farm: Sideways or a Trap?🌍 Macro Background
Continuing to monitor U.S. – Iran tensions and whether escalation occurs.
Japan: maintaining a weak JPY → USD remains supported.
A heavy news week ahead:
FED speeches (today)
Labor market data
Inflation data later this week
👉 Market sentiment remains cautious, waiting for a clearer directional catalyst.
📈 Trend & Structure
Overall price structure remains unchanged: Gold is in the final phase of a corrective rebound.
Upside momentum still exists, but limited, while reversal risk is increasing.
Price is consolidating near resistance → sideways conditions are favored.
🔴 Resistance – 🟢 Support
🔴 Resistance: 5,050 – 5,100
🟢 Near support: 4,980 – 4,950
🟢 Additional support: 4,930 – 4,936
🟢 Deeper support: 4,880 – 4,850
📊 Trading Scenarios
✅ Primary scenario (higher probability): Sideways – range trading
Sell reactions around 5,050
Condition: rejection candles / bearish confirmation
Buy technical pullbacks at support zones
Focus on M15 – H1, quick and disciplined trades.
⚠️ Alternative scenario (lower probability): Bullish breakout
Mandatory condition: H1 close clearly above 5,100
Only then consider buying the breakout.
🧠 Risk Management
Avoid holding large positions during:
FED speeches
Labor market & inflation releases
No FOMO — wait for candle confirmation. GOLD ahead of US Jobs & Inflation Data: Which Scenarios Matter?🌍 Macro Context & Market Expectations
This week, the market is closely focused on:
US employment data
US inflation data (CPI / PCE)
Additionally, traders are monitoring:
Developments in US–Iran negotiations
US Supreme Court rulings related to trade tariffs
→ These factors may amplify short-term volatility, especially around key technical levels.
📈 Trend & Market Structure
Medium-term trend: BULLISH
Price has rebounded strongly from the ~4,700 low to around 5,04x
Last week printed a bullish Hammer candle, confirming long-term buying interest
On the H12 timeframe, the A–B–C corrective structure is not yet complete
Short term: price is consolidating within a tightening range, waiting for a clear breakout
🔑 Key Price Levels
🟢 Support:
5,000 | 4,950 | 4,930 | 4,850 | 4,700 | 4,650
🔴 Resistance:
5,050 | 5,095 | 5,100 | 5,110 | 5,200 | 5,300
🎯 Primary Scenarios
✅ Bullish continuation
Price holds above 4,930 and breaks decisively above 5,050
→ Potential upside toward 5,095 – 5,100, and further to 5,200 – 5,300
❌ Failed breakout / Pullback
Price fails to clear 5,050 and closes below 4,930
→ Likely correction toward 4,850, with deeper pullback to 4,700 – 4,650
🧭 Trading Strategy
Prioritize buy-the-dip opportunities in line with the trend
Avoid counter-trend shorts unless clear reversal signals appear at resistance
Stay patient and avoid FOMO — only trade when risk–reward is clearly defined Long 
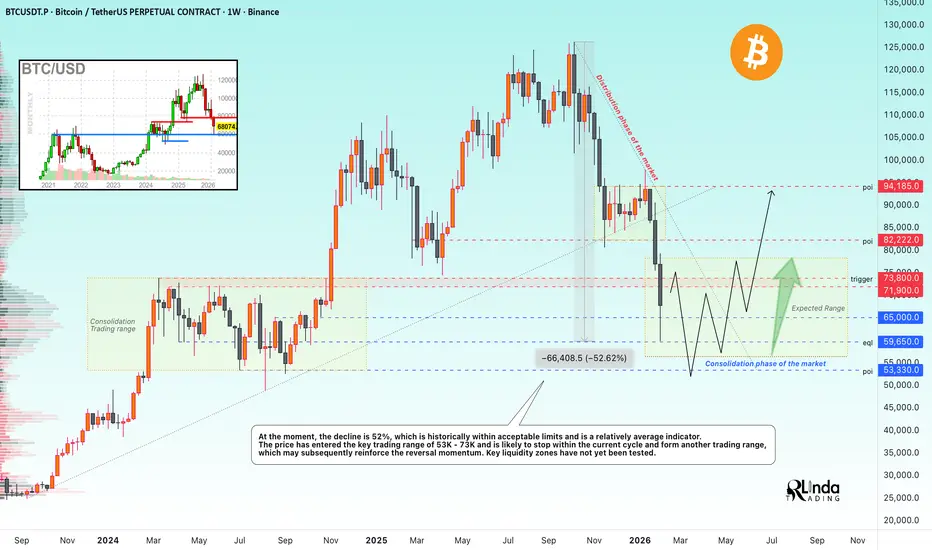
BITCOIN - From the DISTRIBUTION phase to the CONSOLIDATION phaseBINANCE:BTCUSDT.P tested 60K during the current cycle and formed a fairly significant pullback to 70K. However, it is too early to talk about a bullish trend; this is just a reaction to liquidation. The cycle continues...
At the moment, the decline is 52%, which is historically within acceptable limits and is a relatively average indicator.
Fundamentally, there is no support for the crypto market, and Friday's pullback was supported by the recovery of the US stock market.
Global and local trends are bearish, and local spikes in volume and bullish impulses are possible in the hunt for liquidity, which should be viewed conservatively.
The price has entered the key trading channel of 53K - 73K and is likely to stop within the current cycle and form another trading range, which may subsequently reinforce the reversal momentum. Key liquidity zones have not yet been tested: 59650 - 53330.
Resistance levels: 71,900, 73,800, 82,200
Support levels: 65,000, 59,650, 53,330
How can we tell that the market is ready to reverse? Technically, the reversal phase does not come immediately after distribution, the cycle of which is still ongoing. The market must enter a consolidation phase with the gradual formation of sequentially rising lows/highs. The breakdown of local structures + the market holding above key resistance levels will hint at a positive market sentiment.
Thus, we are waiting for the formation of an intermediate bottom and a change in the market phase from distributive to consolidation...
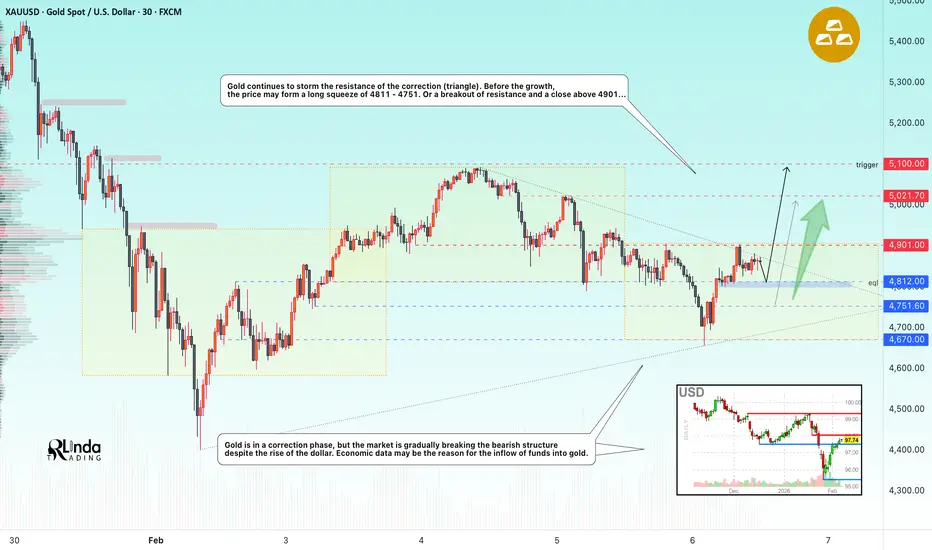
Best regards, R. Linda! GOLD - Consolidation in a symmetrical triangle. Up or down? FX:XAUUSD showed signs of recovery on Friday, but the price is stuck within the boundaries of a symmetrical triangle, which generally indicates market uncertainty.
Key fundamental factors
The ADP, JOLTS, and unemployment claims reports pointed to weakness in the labor market, supporting expectations of two Fed rate cuts this year, which is positive for gold. Upcoming US-Iran talks are supporting demand for safe-haven assets, despite the conclusion of the Ukraine talks. Other central banks (the ECB and the Bank of England) easing policy has strengthened the dollar, putting pressure on gold.
Gold's attempt at recovery looks vulnerable. Although weak employment data and geopolitical risks provide support, the main counterforce remains the global rotation of capital in favor of the US dollar.
Technically, the market may have a chance to break through the correction resistance, but will there be support from traders?
Resistance levels: 4901, 5021, 5100
Support levels: 4811, 4751, 4670
I expect that before attempting a breakout, the market may try to test liquidity in the 4812 zone. However, if the market breaks through the resistance conglomerate and manages to close above 4901, then the market will be able to continue its growth towards 5000.
Otherwise, if 4812 does not hold the price, the market will close within the boundaries of a symmetrical triangle (flat).
Best regards, R. Linda! Long 
Short 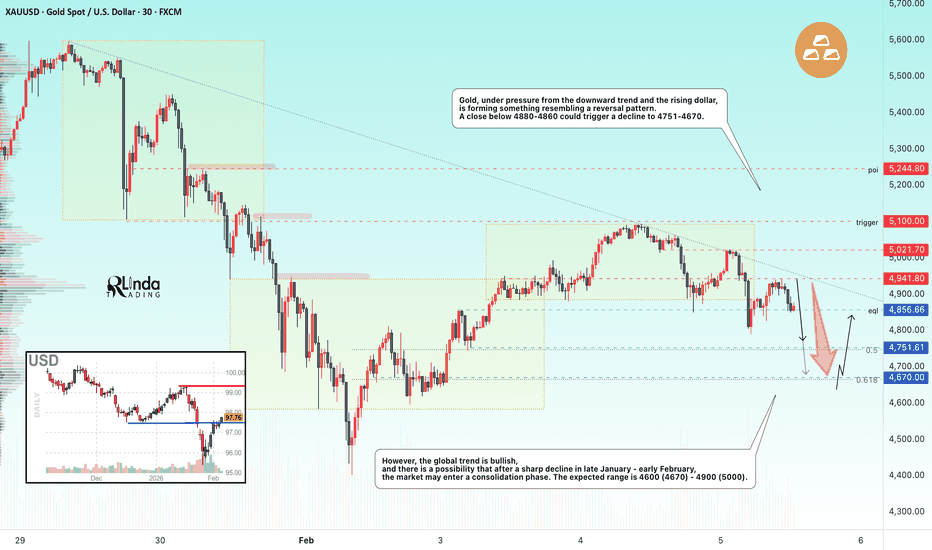
Few lessons from losing positions.GBPUSD long: FOMO, Big Fib less than 50, middle 50, small - none - consolidation around 29.2, tight SL, low confidence, rejection from middle fib 50.
USDCAD short: Stop loss placement, tight SL,late second entry on the wrong side of pedulum.
GBPUSD short: wishful trading, calling the top, impatience, fail to read market structure,narrow focus.
USDJPY short: vibe trading, calling the top, tight stop loss, cutting the winner short.
GBPAUD long: counter trend, fib as a catch, fail to read market structure,

 Short
Short
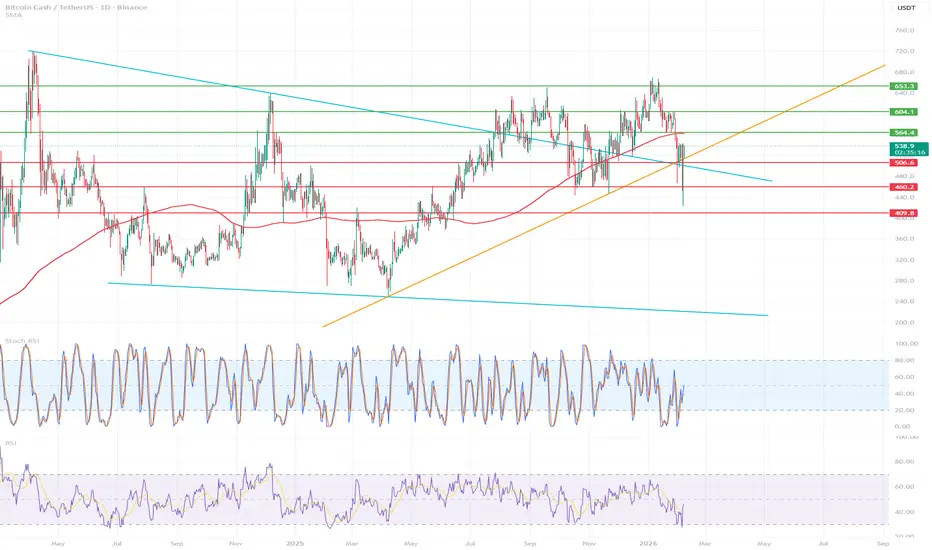
BTC/USDC 1D Chart🔴 Market Structure
Main Trend: BEARISH
Broken long-term uptrend line (orange)
Strong downward impulse (blue arrow) → classic distribution after ATH
Price below key MAs (red average) → supply-side market
📉 Price Action – what exactly happened
ATH → Lower High
Loss of support ~101,800
Retest and rejection
Breakout of 86,800
Lack of demand → free fall
This doesn't look like a "shakeout," but rather a change in market structure.
🟢 Key Levels (Very Important)
🔹 Resistance (Short Zone)
74,400 – Now Technical Resistance
86,800 – Main Structural Resistance
101,800 – Full Trend Recovery (Unrealistic Short-Term)
🔻 Support/Downside Targets
63,200 – First Reasonable Stop
57,500 – Very Important Level (Previous Base)
42,500 – Final HTF Support, Panic Sell Zone
If 57.5k Breaks Weekly → 42k Becomes a Realistic Target.
📊 RSI Stochastic
Still oversold, but:
⚠️ In a downtrend, oversold ≠ long
No divergence → no reversal signal
🧠 Scenarios
🐻 Baseline scenario (70%)
Pullback to 74–78k
Rejection
Continued decline → 63k → 57k
🐂 Alternative scenario (30%)
Quick reclaim 74k
Consolidation
But without a return above 86k, it's just a relief rally Chumtrades XAUUSD Has Wave B finished?GOLD – DAILY PLAN
Has Wave B finished?
→ No confirmation yet.
Macro & Market Sentiment
US–Iran negotiations have been cancelled. Geopolitical risks remain, but not strong enough to trigger a new bullish wave.
Gold experienced a relatively calm trading session, failed to break above the key level around 5,100, and saw a moderate pullback during the US session.
The Daily candle formed a Spinning Top, indicating market indecision and consolidation, with a lack of momentum for a breakout.
👉 Macro factors are supporting prices, but not pushing the market into an immediate uptrend.
Technical Structure & Outlook
Price is still moving within a descending price channel.
On the H1 timeframe, price has broken above the 4,888 key level, showing a technical rebound.
However, the higher timeframe structure remains bearish, with no confirmed trend reversal.
→ Therefore, current rebounds are considered pullbacks within a downtrend.
Key Levels
Support: 4,810 | 4,830 | 4,700–4,750 | 4,650–4,624
Resistance: 4,950–5,000 | 5,100
Trading Scenarios
Primary strategy: Sell the rallies within the descending channel.
Look for SELL setups near resistance zones, targeting lower lows.
Momentum SELL may be considered if price clearly breaks below 4,882–4,890, with confirmation on H2 or H4, targeting around 4,810.
No BUY positions while price remains inside the descending channel.
👉 Only if price breaks and holds above 5,100, will we start reassessing a trend-following BUY scenario.
👉 Deeper pullbacks are viewed as potential zones for swing BUY opportunities, not short-term buys at this stage.
Note: The market is in a “confidence-testing” phase. Focus on zone-based trading, trend alignment, reduced position size, and avoid FOMO. Long 
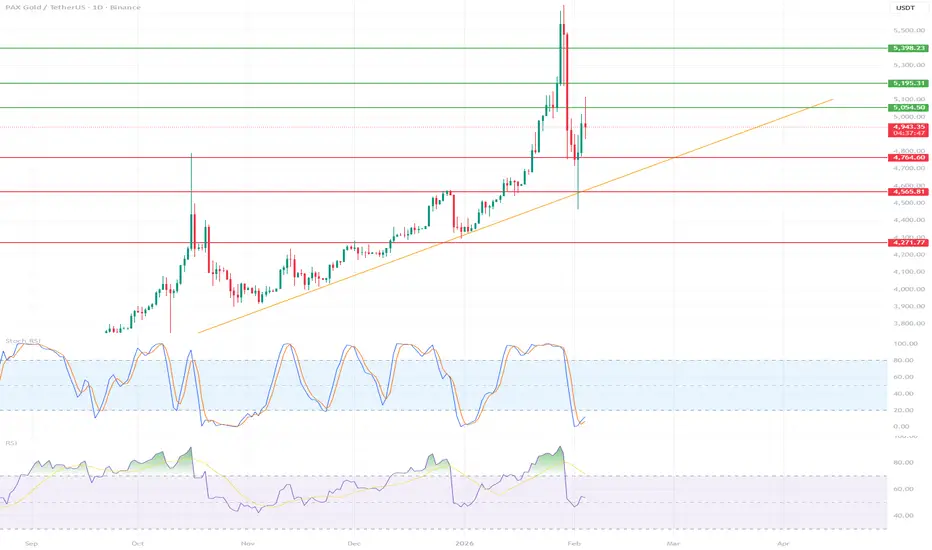
PAXGUSDT 1D🧭 Timeframe & Context
PAXG / USDT – D1
Strong uptrend for many months (clear HH/HL sequence)
Last move: impulse + very aggressive correction (long wick + dump)
📈 Main Trend
The uptrend is still in effect, but:
The market is in a correction phase after the euphoria
The short-term structure has been breached
🟠 Trendline (orange)
Price has broken below / is testing it from above → a key decision point
🔑 Levels (most important)
🟢 Resistance
5,054 – local resistance / reaction zone
5,195 – 5,235 – strong supply zone (this was a fake breakout)
5,398 – ATH / market ceiling
🔴 Support
4,960 – 4 950 – current combat zone
4,764 – very important HL (loss = deeper correction)
4,565 – key structural support
4,277 – "last line of defense" of the D1 trend
📉 RSI & Stoch RSI
RSI (D1)
Drop from high levels → market cooling
Still above 50 → uptrend not broken yet
No bullish divergence (yet)
Stoch RSI
Coming out of oversold
This offers potential for a short-term bounce, but:
bounce ≠ trend reversal
🧠 What's really happening here?
This is a classic pattern:
🚀 Strong impulse (FOMO)
❌ False breakout + liquidity dump
🔄 The market is testing whether the bulls still have fuel
🎯 Scenarios
🟢 Bullish (more likely if…)
We hold 4,950–4,960
We return above 5,054
Targets:
5,195
5,398 (ATH)
🔴 Bearish (if…)
D1 close below 4,764
Then:
4,565
4,277 as a deep pullback

 Long
Long

 Long
Long