A clue of where xrp can head based on it being a fractal of 2016Ok this will be a slightly extensive dive into how the current breakout move from the multi year triangle that xrp just broke out of has a high probability of being a fractal of the triangle pattern breakout move xrp did in 2016 that yielded explosive parabolic bullish price appreciation. I want to start with this image on xrp on the Monthly chart to show how the first monthly candle that confirmed the breakout of the 2016 triangle went up 287 percent and the first monthly candle confirming the
LOGARITHMIC
Bullflag on bitcoin’s monthly log chart putting up big numbers 200k by May?! The measured move target is over 200k and the trajectory of the ensured move line suggests that it could even potentially reach this target in the first half of 2025. A very exciting notion let’s hope it can and will. I do expect one steep corrections on the way to this target. *not financial advice*
An update on the monthly log channel chart from AprilI posted this chart idea originally all the way back in april when I discovered that all the major tapas and bottoms of the market since the 2017 top until now are all in a very clear set of rising channels seen best on the 1 month log chart as shown here. We can see since that time in April, Bitcoin has now broken back upward and is very close to retesting this super strong trendline just above it currently around 47-48k. This trendline is likely to be significant resistance, however there is a
4 potential shorter timeframe triangles on rep 1wk log chartMy previous chart idea which I will link to below showed the monthly timeframe logchart of the 2 potential larger triangles xrp has been consolidating in, so I wanted to also follow that up with a weekly chart timeframe of the the 4 potential smaller triangles we have also been consolidating in so I can eep track of their progress as well. All the potential measured move ines here have been randomly placed so of course where ever it does break upward will likely be slightly different and will on
Xrpusd Bullishpennant on the 1month timeframeSame pattern as the previous idea i just posted but I’ve switched it from the 3 month chart to the 1 month time frame in order to keep track of the developments in price action more quickly. Im also going to post this pattern one more time but on the weekly timeframe as well. The 3 targets remain the same. *not financial advice*
XRP can breakout of logchart triangle once .59 is sold supportThe top trendline of this logarithmic weekly chart symmetrical triangle has played amazing resistance for quite some time now. However since that trendline is a descending one, the price that xrp’s price action needs to maintain as support gets lower and lower with every weekly candle close. Currently, if xrp can flip 59 cents to solidified support and maintain that support for multiple weekly candles it would validate the breakout. By next week’s candle it could be even lower. For the sake of t
Bitcoin’s entire history is just a series of bullflag fractalsOn the entire bitcoin history index monthly logarithmic chart we can see how Bitcoin is nothing but bullflags. The second bullflag we broke up from took 2 bull runs to hit its full breakout target. The first one however because of how insanely long its pole is, has still yet to hit its full breakout target. It is now the 4th consecutive bull market since it broke out of the first flag though so perhaps it will reach that target this bull market, if not this market I’m confident the 1st flag wil
2 overlapping invh&s patterns on the weekly logchart for XLMThe inverse head and shoulders with the yellow neckline is the same one that is on the linear chart, however on the log chart you get a much higher target of around 44 cents. Reaching that target will also push price above a second bigger inverse head & shoulder neckline (in green) which once that one validates its breakout, it’ll have a full target of around 81 cents. Watch for the weekly 200ma(in blue) to hold support here if so not a bad place for an entry, if not retesting the yellow necklin
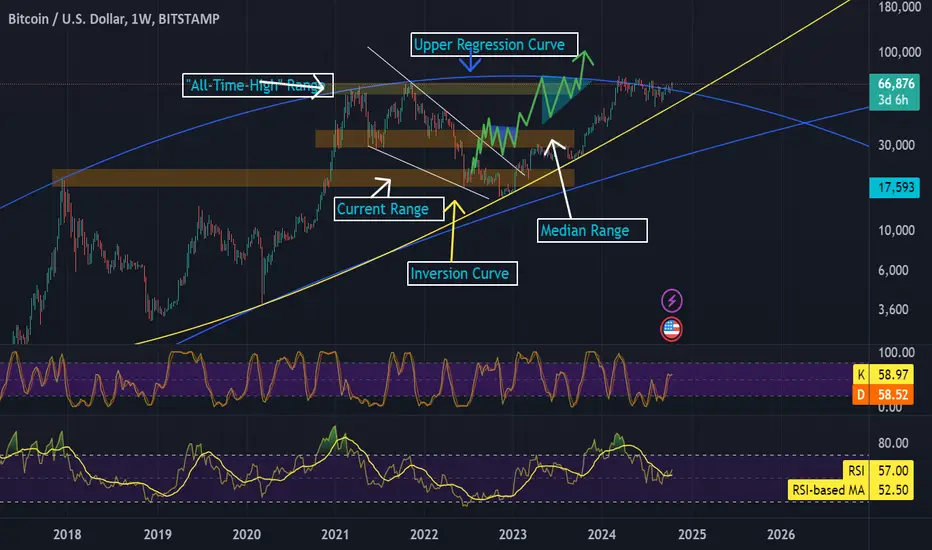
Bitcoin: $300k by 2025Long-term Bitcoin analysis using a logarithmic scale. As shown, Bitcoin remains in the long term trend lines set by the top and bottom of the 2014 bear market, if Bitcoin is to remain in these trend lines, it needs to start making an upwards move in early 2019. I have also drawn a few curves that Bitcoin could follow if it is to fall below the trend line.
My first price target is $100k which I expect to be met between mid 2020 and mid 2021. I then anticipate another 12-16 month bear market befor
XRPETH chart may finally be ready to reclaim some gainsIf price can get above the monthly 50MA here (in orange), and flip it solid support for a candle or few, we should see xrpeth confirming the breakout from this monthly chart falling wedge and then heading up to reach the measured move target posted here. This is a logarithmic chart. *not financial advice*
Bullpennant on 3month logchart for ETH has outlandish targetsIf we went just by the triangle portion of the pennant breakout target, that can take ethereum to 20k. This is potentially a possible target that can be hit during the current bullrun, the second higher target in the 200 thousands is for the entire pennants breakout target. Seems way less likely we can hit that target this bull run but is perhaps not improbable to reach by the bull run after this. Then again, if PlanB’s scenario for bitcoin to somehow reach a million before 2026 actually somehow
Cup & handle and Bullflag have much higher target on logchartHere on the monthly logarithmic chart we can see both the cup and handle and the bull flag that Bitcoin is starting to break upwards from. Both of these patterns are also very much so valid on the linear chart as well, but as usual, the logarithmic version of these patterns has a much higher ensured move target for their breakouts. While there’s a probability we could hit these higher logarithmic targets during this bull ru, often times the logchart patterns take considerably longer to hit their
Bitcoin: The Short and Long (Term) ViewI want to give a video breakdown of my last Tradingview post which did very well as an Editor's Pick. Commentors posed some very good questions that deserve detailed explanations.
First, I talk about the confluence of three major levels of Resistance that setup last week and remained the overhead Resistance of INDEX:BTCUSD Bitcoin this week (and possibly in the short term).
Finally, lest I be accused of being TOO BEARISH... my LONG TERM view (going out for the next decade and beyond) using
Nik by Dl InvestHello community,
A little daily analysis in log scale, because I use the "Adaptive Trend Finder" and "Price Action Ultimate" indicator.
The channel is bearish.
I drew a Fibonacci retracement in log, to see if there is a golden zone.
If the theory works, we have a target around $90.62.
Nothing says that the title will rebound, change of CEO, so we can hope for change in a while.
Make your opinion, before placing an order.
► Thank you for boosting, commenting, subscribing!
bullpennant on the xrpusd 3month logarithmic chartJust posting an updated version of this Also going to post a 1 month timeframe version of it and a weekly timeframe version of it to keep track of how it develops. We can see 3 main targets should the entire pennant be validated and not just the symmetrical triangle. First one is 10 dollars, then 33, then 609. These amounts can of course change somewhat depending on wherever the actual breakpoint occurs. *not financial advice*
Optimizing Technical Analysis with Logarithmic Scales▮ Introduction
In the realm of technical analysis, making sense of market behavior is crucial for traders and investors. One foundational aspect is selecting the right scale to view price charts. This educational piece delves into the significance of logarithmic scaling and how it can enhance your technical analysis.
▮ Understanding Scales
- Linear Scale
This is a common graphing approach where each unit change on the vertical axis represents the same absolute value.
- Logarithmic Sc
Bitcoin In DANGER: Back to $20,000?Preface: I don't think that going back to $20k is the most likely scenario at this point in time. However, it's valuable to discuss different potential outcomes in an every-changing market. If you disagree and only want to look at one potential outcome it's up to you.
In this analysis I want to take a look at one of my more popular indicators; Bitcoin's Logarithmic Price Bands. In case you want to know more about this indicator, please check out the link on the bottom of this post.
Back in Mar
Weekly log chart on quant has a easured move target over 1k.The price action currently just closed a weekly candle below the triangle for the first time, however when you take the same measured move line to ensure a breakdown from the channel the result is an impossible negative price which tells us that probability greatly favors a break upward from this triangle eventually. I went ahead and arbitrarily placed the breakout line fairly close to the triangles apex as a guesstimate. Now being that this is both a weekly time frame and on the logarithmic sca
🔥 Bitcoin In Area Of DANGER: Macro Signal! 🚨In this analysis I want to take a look at one of my more popular indicators; Bitcoin's Logarithmic Price Bands. In case you want to know more about this indicator, please check out the link on the bottom of this post.
Back in March I made an analysis with the same title, where I argued that Bitcoin had entered an area of danger (the yellow mid band of the indicator).
The yellow band has historically proven to be a strong resistance. With BTC retesting the bottom support of the yellow band th
Symmetrical Triangle on the monthly XRPUSD log chartAs usual, the logarithmic chart’s measured move target is much higher than the linear charts measured move target for the symmetrical triangle. We can see here that it is getting very close to the apex of the triangle on the monthly chart and should likely see some sort of a breakout by the end of June if not sooner. Target on logarithmic chart is around $11.47 for just the triangle alone, but that could take price action a longer amount of time to reach the full target of than it will take the
$EXRD / $XRD HopiumHumans struggle to comprehend exponential curves, but the history of crypto has shown that the log chart it is the only rational TA method for mature projects.
If Radix were to match the market cap of Solana CRYPTOCAP:SOL , its price would be ~$7.50. Radix's superior tech, narrative, and ecosystem could 10x that, and at the apex of the bull market 5-10x that again.
Therefore, we are giving a price target of ~$200 before the end of the year, with Bitcoin at $400k by the same analysis.
ELong