Ethereum Weekly | One Larger Structure, Two Scenarios⏱️ Reading time: About 3 minutes
On the Ethereum Weekly chart, it helps to step back from the short-term price movements and focus on the larger market structure.
From the beginning of the chart, we can follow a larger impulsive structure, where waves I, II, and III are marked at their respective degree.
After the formation of III, the market entered a more complex corrective period, with several swings developing along the way. The main question now is whether this larger correction is appro
Multiple Time Frame Analysis
LINKUSDT Bullish Pennant Signals Major ContinuationLINKUSDT previously printed a major all-time high around the $53 level before entering an extended corrective phase that retraced approximately 90% of the entire bullish expansion. This correction ultimately culminated in a strong structural bottom near $4.70, where demand decisively absorbed selling pressure. Since establishing this low, price has transitioned into a recovery phase, gradually rebuilding bullish structure.
Currently, LINKUSDT is consolidating within a bullish pennant formation,
Bitcoin Daily | The Structure Is Still the Story⏱️ Reading time: About 3 minutes
On the Bitcoin Daily chart, the main question for us is not simply whether price is going up or down.
The more important question is:
What is the current structure telling us?
From the major low marked on the chart, Bitcoin has developed a significant upward move. Now, we are watching one of the most important structural decision points in the market.
Scenario 1: Bullish Case
In the bullish scenario, the current upward move could be part of a larger impulsi
EURCAD LONGMarket structure bullish on HTFs DH
Entry At both Weekly and Daily AOi
Weekly Rejection at AOi
Daily Rejection at AOi
Previous Daily Structure Point
Around Psychological Level 1.60500
Touching EMA H4
H4 Candlestick rejection
Rejection from Previous structure
TP: WHO KNOWS!
Entry 100%
REMEMBER : Trading is a Game Of Probability
: Manage Your Risk
: Be Patient
: Every Moment Is Unique
: Rinse, Wash, Repeat!
: Christ is King
USDCHF LONGMarket structure bullish on HTFs 3
Entry at both Weekly and Daily AOi
Weekly Rejection at AOi
Weekly Previous Structure Point
Daily Rejection at AOi
Previous Daily Structure Point
Touching EMA H4
H4 Candlestick rejection
Rejection from Previous structure
TP: WHO KNOWS!
Entry 115%
REMEMBER : Trading is a Game Of Probability
: Manage Your Risk
: Be Patient
: Every Moment Is Unique
: Rinse, Wash, Repeat!
: Christ is King
GRG - UK Food retail LongMeant to post this before the market opened but missed it.
Only enter if price reaches entry point, to reduce risk.
Weekly chart
Holding a historical price level.
Price broke out of an accumulation range, and back testing the break out. Easier to see on daily chart. Is now entering a fast price action zone.
Similar to Wyckoff Back Up move.
Bullish Divergence on MACD daily.
2 Targets
Stick to stop loss
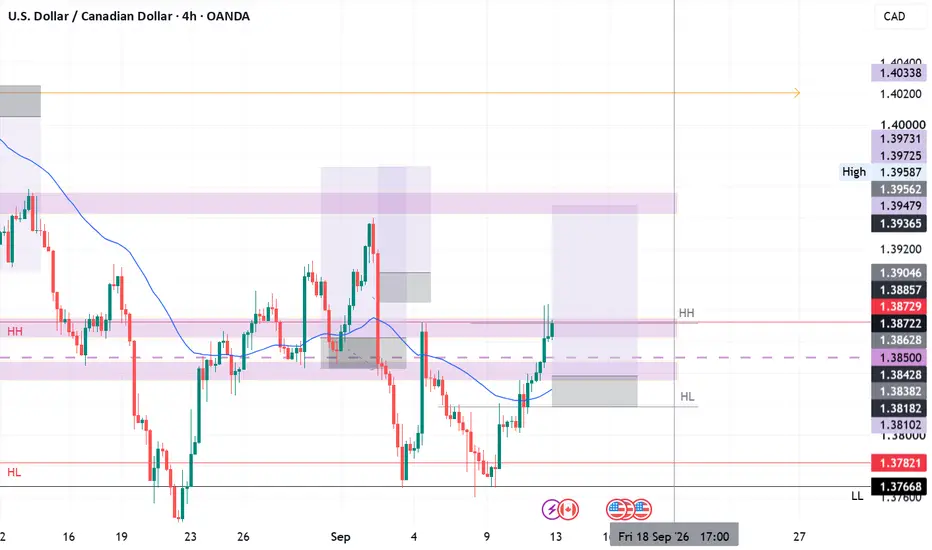
USDCAD LongMarket structure bullish on HTFs DH
Entry at both Weekly and Daily AOi
Weekly Rejection at AOi
Daily Rejection at AOi
Previous Daily Structure Point
Around Psychological Level 1.38500
Touching EMA H4
H4 Candlestick rejection
Rejection from Previous structure
TP: WHO KNOWS!
Entry 100%
REMEMBER : Trading is a Game Of Probability
: Manage Your Risk
: Be Patient
: Every Moment Is Unique
: Rinse, Wash, Repeat!
: Christ is King
NZDUSD ShortsMarket structure bearish at AOi 3
Weekly Rejection at AOi
Daily Rejection at AOi
Daily EMA retest
Previous Daily Structure Point
Around Psychological Level 0.58500
Touching EMA H4
H4 Candlestick rejection
Rejection from Previous structure
TP: WHO KNOWS!
Entry 115%
REMEMBER : Trading is a Game Of Probability
: Manage Your Risk
: Be Patient
: Every Moment Is Unique
: Rinse, Wash, Repeat!
: Christ is King
Bitcoin enters week Gaussian channel - September 2026Next stop: $95-96k with 100% probability.
Do you remember this idea?
At that time price action printed a candle body inside the channel around 101k on the weekly chart. Fairly unpopular amongst the Bitcoin maxis to tell them precious was going down.
Price action has now confirmed the channel once more. And the 100% ??
“At its core statistics is not about cleverness and technique, but rather about honesty.”
as my professor in operational research used to quote me.
Statistics also say
SUI Base Zone Holds as Momentum ImprovesSUI is trading within a falling wedge structure, presenting a potential bullish reversal setup. Price continues to hold the 0.52–0.62 base zone, while bullish RSI divergence suggests improving momentum. A confirmed break above 0.918 key resistance could open the way toward 1.80–2.00 internal supply, with 4.00–4.30 HTF supply as the broader upside area. A rejection at resistance could send price back toward the base zone.
Probability over prediction.
WESLAD Research
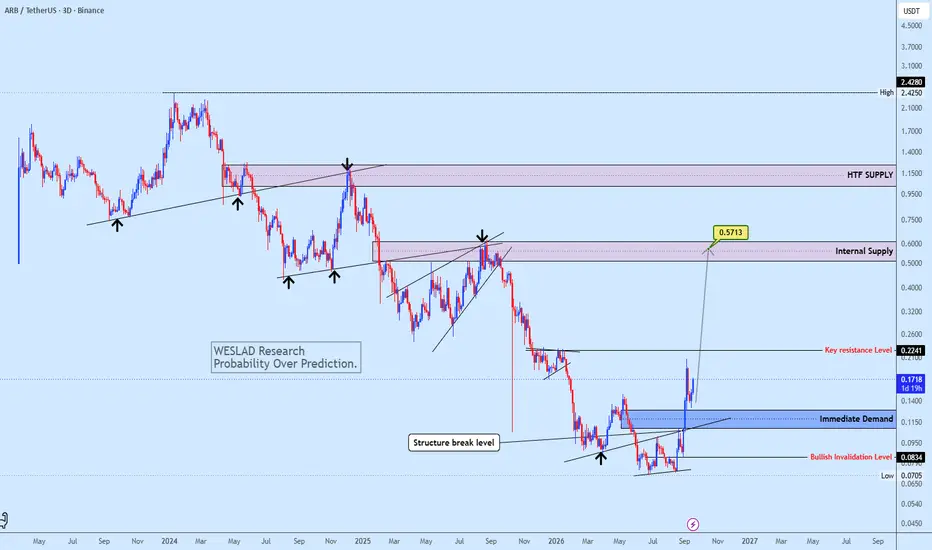
ARB Structure Break, Retest, Then ExpansionARB has broken its recent bearish structure and could now see a pullback into the immediate demand zone, providing a potential entry opportunity before the next push toward 0.2241 key resistance. A confirmed break above 0.2241 could open the way toward our 0.50–0.60 internal supply zone and final projection target. The bullish structure remains valid above 0.0834 invalidation.
Probability over prediction.
WESLAD Research
Siren | Day chart | April 2026** T.A explained **
Basics:
Ranges = two or more consecutive color candles.
There are two types of ranges - accumulation and distribution.
A single candle is a range on a lower timeframe. We only look at the first and last candle in each range.
DISTRIBUTION RANGES DEFINED: BackSide (BS) Candle - First distribution candle in a distribution range. Expectation = strong reaction to price. long wicks reaching to or away from level.
FrontSide (FS) Candle - Last distribution candle in a distribution r
SOL | Week Chart | 2026** T.A explained **
A Range = two or more consecutive color candles.
There are two types of ranges - accumulation and distribution.
DISTRIBUTION RANGES DEFINED: BackSide (BS) Candle - First distribution candle in a distribution range. Expectation = strong reaction to price. long wicks reaching to or away from level.
FrontSide (FS) Candle - Last distribution candle in a distribution range. Expectation = reversal, create a trend in the opposite direction. Distribution candles are used as support.
DOGE | Week Chart | 2026** T.A explained **
A Range = two or more consecutive color candles.
There are two types of ranges - accumulation and distribution.
DISTRIBUTION RANGES DEFINED: BackSide (BS) Candle - First distribution candle in a distribution range. Expectation = strong reaction to price. long wicks reaching to or away from level.
FrontSide (FS) Candle - Last distribution candle in a distribution range. Expectation = reversal, create a trend in the opposite direction. Distribution candles are used as support.
Citadel | 2026 | week chartThose lower support levels look good. Especially. the yearly level backed by the yearly accumulation trend at $16.
** T.A explained **
Basics:
Ranges = two or more consecutive color candles.
There are two types of ranges - accumulation and distribution.
A single candle is a range on a lower timeframe. We only look at the first and last candle in each range.
DISTRIBUTION RANGES DEFINED: BackSide (BS) Candle - First distribution candle in a distribution range. Expectation = strong reaction to p
XAU/USD 18 September 2026 Intraday AnalysisH4 Analysis:
-> Swing: Bullish.
-> Internal: Bearish.
Bias and analysis to remain the same as analysis dated 30 June 2026.
Price did not print bullish CHoCH to indicate bullish pullback phase initiation. Price instead printed a new low followed by a bullish CHoCH
Price is currently trading within and established internal range, however, I will continue to monitor price with respect to depth of pullback.
Intraday expectation:
Price to trade up to either premium of internal 50% EQ, or
USDJPY LOOMING SHORTS Rate hikes are part of Central Bank conversations in 2026 as they seek to arrest inflation. The Bank of Japan has responded accordingly by raising rates to support its currency and keep inflation at manageable levels. Presently, price is in a correction phase targeting two possible areas of supply, 159 or 162 . Once price contacts one of these areas and gives us a confirmation, we will look for sell limits targeting the monthly sell side liquidity as the exit.
PONKE AT MAKE-OR-BREAK SUPPORTYello, Paradisers! Is PONKE about to trap impatient bears at one of the most important support zones on the chart before attempting a much stronger upside expansion?
💎PONKEUSDT is currently trading around $0.0207 after another rejection from the upper boundary of the 4H falling wedge. While the lower timeframes remain bearish, the bigger picture is becoming increasingly interesting because price has once again reached a major Daily support area around $0.0198–$0.0186.
💎What makes this zone esp
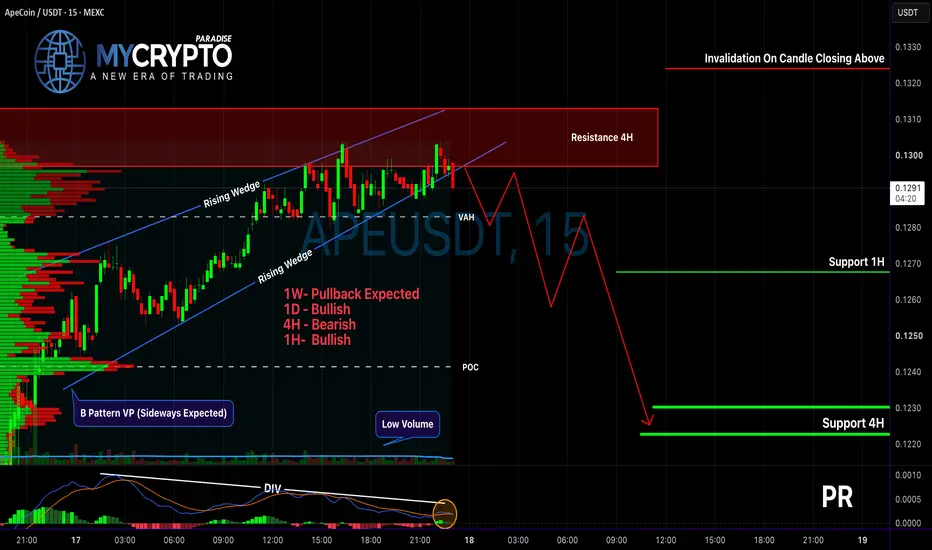
APE Bulls Running Out of Time?Yello, Paradisers! Are #APEUSDT bulls about to get trapped right below a major resistance zone before the market delivers the pullback most traders are not prepared for?
💎#APEUSDT is currently trading around $0.1296 after pushing directly into an important 4H resistance area around $0.1297-$0.1313. At the same time, the price continues to respect a rising wedge structure on the 15-minute timeframe, which puts the market in a very sensitive position.
💎The short-term structure remains bullish wh
EUR/USD — Larger Correction or the Continuation of the Bullish T⏱️ Reading Time: ~4 minutes
On the EUR/USD chart, price is currently at an important point within the larger-term structure.
From the 1.60360 peak, a major bearish structure developed into the 0.95356 low. Since then, EUR/USD has produced a significant recovery.
The key question now is whether this recovery is still part of a larger correction, or whether it is developing into the beginning of a larger bullish trend.
🟦 Bullish Scenario — A Larger Uptrend
In the turquoise scenario, the advan