XAUUSD: Bullish Continuation Needs the ABC Buy Zone◈ XAUUSD: Bullish Continuation Needs the ABC Buy Zone
Gold is still holding a constructive recovery structure after the latest rebound from the lower area. From Kelly’s view, the current pullback looks more like an ABC correction inside a bullish continuation setup, rather than a full bearish reversal.
The key idea is simple: gold may correct first, but the bullish path remains active if price holds the Fibonacci buy zones.
⟡ Market structure
The chart shows gold recovered strongly from the
Pin Bar
MASON XAUUSD – Accumulation Inside Bearish Channel
XAUUSD is trading around 4,120 while still moving inside the medium-term descending channel. Although the broader structure has not fully broken out yet, gold is showing strong accumulation around the lower-middle area of the channel.
The priority view is that gold may continue building a base above the 4,080–4,095 buy zone before attempting a stronger medium-term recovery toward the upper resistance zones.
Technical View
Gold is still inside a bearish price channel on the 6H structure. The
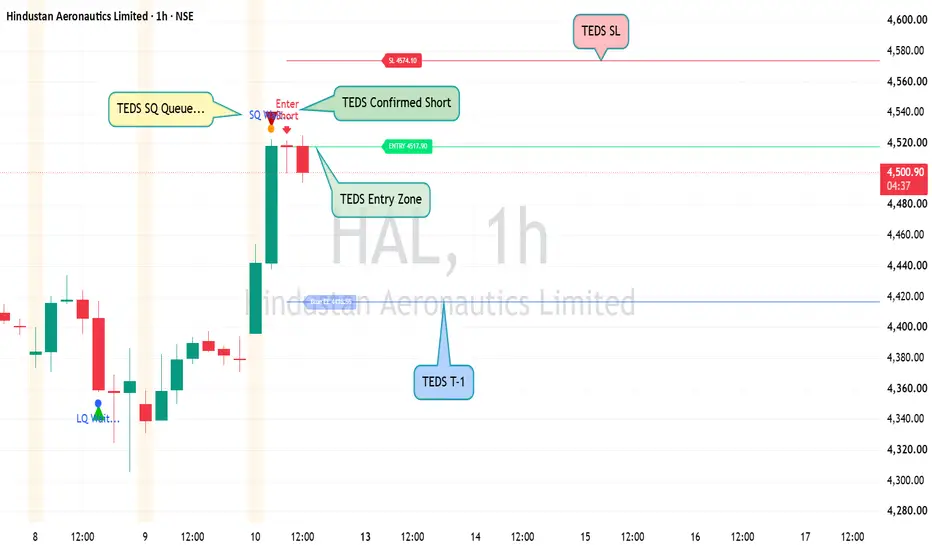
TEDS Swing Trading Analysis | HAL 1H | 10 July 26TEDS Swing Trading Analysis | Confirmation Over Prediction
Strong price moves often create excitement, but disciplined traders know that a move alone is not a trading setup.
The TEDS (Trend Exhaustion Detection System) follows a structured approach by waiting for confirmation before considering a trade.
Chart Observation
🔹 After a strong upward move, the framework identified a TEDS Short Queue, signalling that the market had entered a potential decision zone.
🔹 Instead of initiating an imme
XAUUSD — Bullish Channel Holds Above Buy Zone
Fundamental Analysis
Gold is still reacting to USD momentum, Treasury yields, and upcoming U.S. macro data. For now, the short-term structure remains positive while price continues to hold inside the rising channel.
Technical Analysis
On the 2H chart, XAUUSD is trading around 4,142 and still respecting the bullish channel structure. The main buy order trendline zone is around 4,141 - 4,143. If price holds this area, buyers may continue to defend the trend and push gold toward the liquidity zon
MASON XAUUSD – Bullish Pullback Before Mid-Term Rally
XAUUSD is trading around 4,123 after recovering from the short-term correction zone. Price is still holding above the main uptrend trendline, while the current pullback is moving around the Fibonacci reaction area.
The priority view remains bullish in the medium term, as long as gold continues to hold above the buy order zone and the rising trendline support.
Technical View
Gold is still moving inside a bullish recovery structure. The higher low formation from the previous support area shows
Crash in MorphousdtHello Traders!
MORPHOUSE is at the peak and bulls are not able to push it further and market is forming bearish pattern. There will be a crash in Morphousdt.
We can see a rising triangle in MORPHOUSE and there will be a crash soon after breakout and there are multiple bearish patterns in Morphousdt.
We are selling Morphousdt from 2.1
Stoploss 2.2695(-7.9%)
Target 1.7612(+16.2%)
My goal is to be recognized as one of the highest win-rate traders in the TradingView community. :)
Trade Analy
EURUSD — Bearish EMA Trend, Sell From Fibonacci Value ZoneEURUSD — Bearish EMA Trend, Sell From Fibonacci Value Zone
Fundamental Analysis
EURUSD remains under pressure as traders continue to watch USD momentum, Fed expectations, and upcoming macro data.
For now, the main structure still favours sellers while price trades below the higher EMA resistance zone. Any recovery should be viewed as a corrective pullback unless EURUSD can reclaim the main sell zone with strong confirmation.
Technical Analysis
On the 2H chart, EURUSD is still moving in a be
XAUUSD — Bullish Setup Holding Above Buy Zone
Fundamental Analysis
Gold is still reacting to USD momentum, Treasury yields, and upcoming U.S. data. For now, the short-term structure remains positive while buyers continue to defend the recovery trend.
Technical Analysis
On the 1H chart, XAUUSD is trading around 4,100 and holding above the rising trendline. The key buy order zone at 4,087 - 4,092 is acting as the main value area. If price holds this zone, the bullish structure can continue toward the day high at 4,118, then the liquidity a
XAU/USD Bullish Reversal Setup | 4H Trendline Break Opportunity
Gold is currently trading within a broader bearish market structure, but price is approaching a key demand/support zone where buyers may attempt to regain control. The descending trendline continues to act as dynamic resistance, making the next reaction around this area important.
The current expectation is for price to hold above the highlighted support zone and produce a bullish breakout above the descending trendline. A confirmed break and close above this trendline would strengthen the bul
XAUUSD: Wave 5 Downside May Continue From the Sell Zone
Gold is still trading inside a corrective bearish structure after failing to hold the earlier recovery momentum. From Kelly’s view, the current chart suggests that price may still be developing wave 5 lower, with the sell zone around 4,125–4,135 acting as the key resistance area.
The key idea is simple: gold is not showing a clean bullish continuation yet. As long as price stays below the sell zone, the wave 5 downside scenario remains active.
⟡ Market structure
The chart shows gold moving
EURUSD - Retest of support at 1.143–1.140 before distribution FX:EURUSD is showing early bullish signals. The pair is breaking above the 1.1434 resistance cluster and the descending trendline, opening the door for a potential continuation higher
The latest FOMC minutes did not deliver a clear hawkish message, with markets pricing in only a 25–30% probability of a July rate hike. Meanwhile, the 1.1400 support continues to provide a solid base for a technical rebound. However, renewed geopolitical tensions in the Middle East continue to support the U.S
GOLD - Breakdown from consolidation. Bearish pressureFX:XAUUSD failed to extend last week's rally despite the temporary improvement in the fundamental backdrop. Following yesterday's geopolitical escalation, market sentiment has shifted again, putting renewed pressure on the metal
Gold recovered modestly on Wednesday after its recent decline, but gains remain limited by the stronger U.S. dollar. Market attention is now focused on the minutes from the June FOMC meeting, which could provide further clues about the Fed's rate outlook.
Additiona
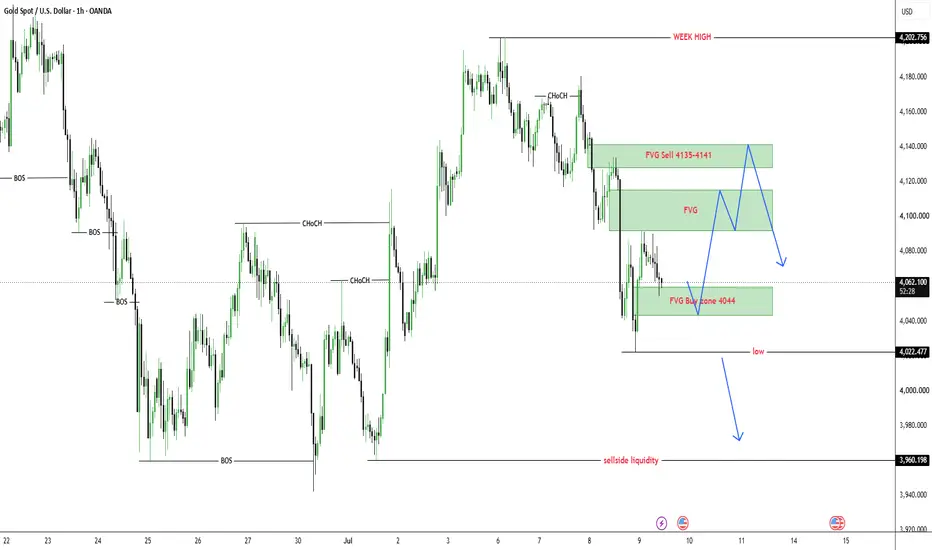
XAUUSD — Corrective Recovery After Rejecting $4,022 Low
Gold is trading around $4,062 after rejecting the lower area near $4,022. The market failed to continue the immediate downside move, so today gold may first create a corrective recovery before deciding the next larger direction.
From an SMC perspective, gold has already swept the lower liquidity near $4,022 and reacted from the FVG buy zone around $4,044–$4,060. This reaction shows that sellers may be losing short-term momentum, but the overall structure is not fully bullish yet. Price still
MASON XAUUSD – Intraday Bearish Bias Below Ichimoku
XAUUSD is trading around 4,057 after losing short-term bullish momentum. Price is now moving below the Ichimoku structure, while the recovery attempt is still weak and has not confirmed a bullish reversal.
The priority view for today remains sell with the short-term bearish structure, especially if gold retests the nearby sell zone and fails to break back above Ichimoku resistance.
Technical View
Gold is currently trading below the Ichimoku cloud and below the short-term resistance structure
XAUUSD — Waiting Sell From EMA Value Zone
Fundamental Analysis
Gold remains sensitive to USD momentum, Treasury yields, and upcoming U.S. macro data. For now, the market is still moving with short-term bearish pressure, so any recovery should be treated as a pullback unless price can reclaim the upper resistance zone.
The better plan is to wait for price to return to a clear sell value zone instead of chasing the move after a strong drop.
Technical Analysis
On the 1H chart, XAUUSD is trading around 4,053 after reacting strongly fr
USD/JPY(20260708)Today's AnalysisMarket News:
According to Proactive Research, traders on the forecasting platform Polymarket are generally bullish on gold continuing its rebound in July, but believe that gold prices will not return to the highs reached in January. Bets are concentrated around the month's high of $4,300 per ounce.
Technical Analysis:
Today's Buy/Sell Threshold:
161.96
Support and Resistance Levels:
162.48
162.29
162.16
161.76
161.63
161.44
Trading Strategy:
A break above 162.29 suggests a buy ent
What Will Gold’s Trend Be at the Start of the Week?Market Outlook
Trend
* The short-term trend remains bullish, with price holding above the ascending trendline and maintaining a Higher High – Higher Low market structure.
* Following the breakout toward 4,185, price is currently undergoing a pullback. As long as key support levels hold, the bullish trend remains intact.
Resistance Levels
🔵 4,185 – 4,187 – Near-term resistance and the key breakout zone. A confirmed H1 candle close above this level would signal a bullish continuation.
🔵 4,227
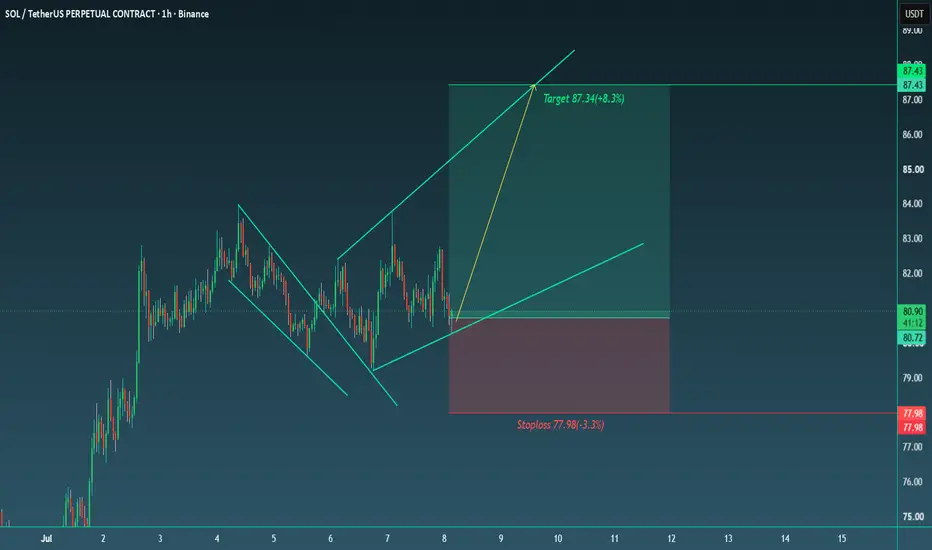
Buying SOL: Trading with BullsHello Traders!
SOL is in tricky position as it can pump hard and it can cross 95$. We are buying SOl from 80.7 but we will not aim much high.
We can see there is a pattern breakout and after the breakout market has started to form another pattern and now i am expecting that market will continue the formation and will for towards the resistive trendline.
Buy SOL from 80.7
Stoploss 77.98(-3.3%)
Target 87.34(+8.3%)
My goal is to be recognized as one of the highest win-rate traders in the Trad
XAUUSD — Bullish Structure Holding, Buy Setup Still Priority
Gold is trading around $4,128 after forming a short-term correction from the upper reaction zone. The main structure remains bullish because price is still holding above the rising trendline and the recent market structure continues to show multiple CHOCH and BOS signals to the upside.
From an SMC perspective, gold has already shifted from the previous bearish leg into a recovery structure. The current movement looks more like accumulation and correction rather than a confirmed bearish revers
XAUUSD 30M Analysis SMC + ICT Liquidity Based Market Structure Gold (XAUUSD) is currently showing a short-term bearish correction after rejecting from a premium liquidity zone near the weekly high area. Price formed a liquidity sweep above previous highs (EQH) and faced strong selling pressure from the institutional order block, indicating that sellers are actively defending the premium zone.
From a Smart Money Concepts (SMC) perspective, the market has shown multiple CHoCH (Change of Character) and BOS (Break of Structure) signals, confirming a shift in sh
HYPEUSDT - Consolidation Before Further Growth BINANCE:HYPEUSDT.P is consolidating within both its local and global bullish trends. Technically, this phase appears to be a period of accumulation before a potential continuation of the uptrend
Bitcoin is currently caught between three major forces: the Fed's softer rhetoric, a reversal in ETF flows, and renewed geopolitical tensions in the Middle East. While Bitcoin remains in a countertrend correction within its broader bearish trend, HYPE continues to show relative strength. The market
XAUUSD — Pullback to Fibonacci Before Bullish Recovery
Fundamental Analysis
Gold remains sensitive to USD momentum, Treasury yields, and upcoming U.S. macro data. For now, the market is still moving inside a technical recovery phase, but traders should avoid chasing price near the middle of the range.
The better plan is to wait for price to return to a clear value zone before looking for continuation.
Technical Analysis
On the 2H chart, XAUUSD is trading around 4,129 after losing short-term momentum near the current EMA area. Price is still hol
XAUUSD: Wave C Pullback May Prepare the Next Buy Setup
Gold is currently moving inside a corrective ABC structure after the previous strong bullish recovery. From Kelly’s view, price is now developing wave C lower, and the next important setup may appear only when this corrective wave finishes around the support zone.
The key idea is simple: gold is correcting now, but if wave C ends cleanly near support, buyers may step back in for the next recovery phase.
⟡ Market structure
The chart shows gold rejected from the upper resistance area after com
XAUUSD – Gold Corrects Into Fibonacci And Ichimoku Support
XAUUSD is trading around 4,129 after pulling back from the recent high area near 4,190–4,200. The short-term bullish structure is still valid, but price is now correcting into an important Fibonacci and Ichimoku support area.
The priority view remains buy on pullback, as long as gold holds above the key Fibonacci zones and does not break below the rising structure.
Technical View
Gold has created a strong recovery from the previous strong support zone around 3,960. The market moved higher and