Algorand Long Trade, 6x Potential by 2026Algorand has retraced to the lower Median Line, presenting a strong investment opportunity.
With current economic conditions favoring altcoins, Algorand stands out.
Oversold at present, I project it to increase 6x from its current level, with a direct move toward the ML likely by 2026 — potentially spearheading the altcoin rally.
I’m personally invested in Algorand with a R/R ratio of 18:1.
Pitchforks
Long Term Brent Outlook, $32 by 2026Weekly Brent has broken a clear barrier and formed a Bull Flag pattern, but the subsequent rally has been weak, not even reaching the breakout level.
The global economy is showing signs of weakening, leading to a reduction in oil demand. Concurrently, Trump's move to lift US production restrictions is boosting oil supply. However, the slight depreciation of the dollar is providing upward pressure on oil prices.
Given these factors, Brent remains relatively weak, and we may see a continued dec
How to Build a Super Pitchfork with Reaction & Trigger LinesIn this educational video tutorial, I guide you through the process of setting up a Super Pitchfork using the Bitcoin daily chart. This method is inspired by Patrick Mikula’s work in " The Best Trendline Methods of Alan Andrews. "
I demonstrate how to:
- Create and project reaction lines
- Generate bullish and bearish trigger lines
- Apply a personal timing technique for pitchforks based on Michael Jenkins’ methods by squaring significant pivots to the median line, reaction lines, and upper par
SUSD 4H Chart – Easy Trend with RSI Signal!SUSD on the 4H chart is in a steady uptrend within a channel since February. After a drop to the 0.285 level, it’s now at 0.382, sitting near the channel’s midline. RSI is at 54.26, showing neutral momentum—room to move either way. The yellow line suggests a potential push to the channel top at 1.0000000 if the trend continues. On the downside, 0.3500000 is key support to watch.
SLong
XAUUSD morning analysisBullish case for XAUUSD.
This count has price in wave 5 of (3) of ((5)).
Based on how price has responded to the pitchfork drawn, I am anticipating the upper boundary
to see profit taking and be the end of wave (3). Measured moves with Fibonacci could have price challenge $3300-3350 area if upper boundary is not resistance.
Anticipated wave (4) to be a zigzag down towards $2600 (recession in 2025?).
If all this plays out, I would expect wave (5) of ((5)) to be quite exaggerated (think 1976-1
DJT/SPX comparisonBearish case for equities.
Chart comparing DJT and SPX. DJT in wave ((c)) of regular flat, SPX in wave ((c)) of expanded flat.
SPX showing ending diagonal (wedge) to complete wave ((b)).
Bottom of SPX pitchfork (blue line) broke support and now acting as resistance.
This count anticipates each market to soon have a large (15-20%) 5-wave impulsive move down, DJT to complete wave 5 of (3) of ((c)) and SPX to complete wave (3) of ((c)).
After this proposed move, each market will have completed
Gold’s Uptrend Strong, But Is a Short-Term Drop Coming?Gold ( OANDA:XAUUSD ) has increased by more than +5% over the past seven days and has managed to create new All-Time High(ATH) daily. The reasons for the increase in Gold prices include US economic statistics and the tensions in the Middle East that have increased these days.
The question is how long this bullish trend in Gold will continue. It seems that Gold needs at least a correction to continue its upward trend and I tried to find the starting zone of the correction
ETHUSD afternoon analysisETHUSD technical analysis.
Bears targeting median line (red line) of larger pitchfork by the end of August 2025.
Median line of smaller, bullish pitchfork never tagged, Hagopian line acted as support at blue arrows, now breached and acting as resistance.
Key levels/support at 1071.11 and 879.80, as well as parallel channel support.
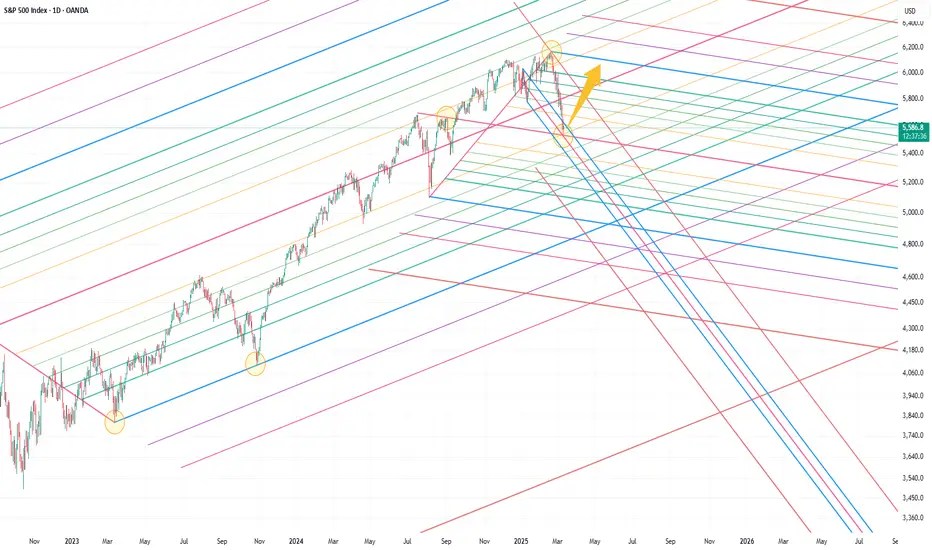
SPX morning analysisTechnical analysis of SPX.
Bearish count/analysis presented, cleaned up to present important points.
Parallel channels frame price action since March 2020 low nearly perfectly, with key pivots pointed out. With count presented, ((B)) is 200% of ((A)).
End of ((B)) counted with impulse ending with ending diagonal wedge. Impulsive price action broke through pitchfork support, looking to see if support now becomes resistance.
If pitchfork median line (red line) cannot be tagged, should be taken
UShort
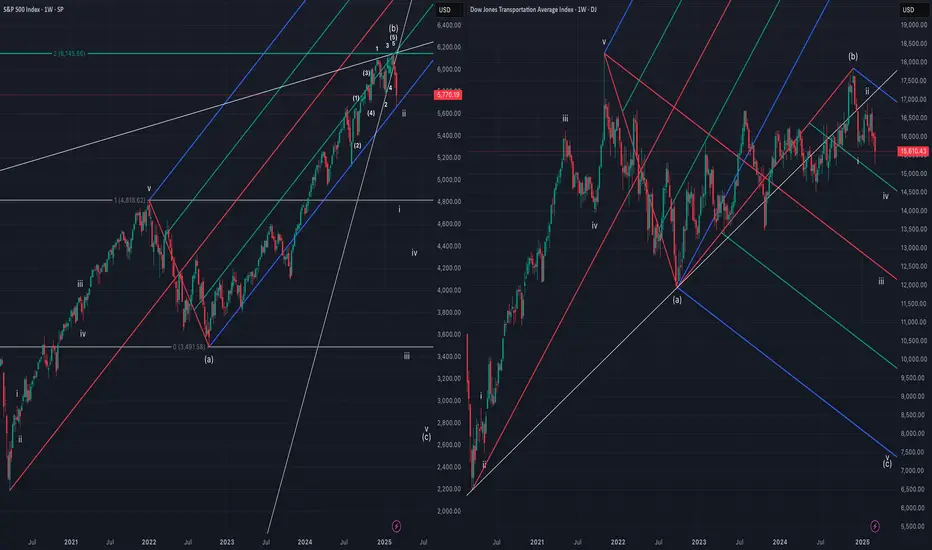
SPX/DJT technical analysisChart comparing SPX and DJT.
SPX drawn with expanded flat, (b) is 200% of (a) and completes with ending diagonal wedge.
DJT drawn with regular flat, (b) ~90% of (a), wave (c) began in November of 2024 and currently in wave iii of (c).
Bears looking for SPX pitchfork support to break and become resistance, both SPX and DJT looking to eventually break October 2022 low and approach March 2020 lows to complete their corrective structures.
Will STXUSDT recover from a failed fifth Elliott wave?
We start our Elliott wave count at the bear market lows (Nov 2022). The first wave tops in March 2023 starting the second wave that bottoms at the 0.618 Fib (typical second wave). The third wave tops along with most of the crypto market in end of March or early April 2024. Then the fourth wave corrects more than expected barely holding the 0.382 Fib, the first wave high and the pitchfork median line support. The fifth wave starts in August 2024 and tops in December 2024, below the third wave h
SPX/DJT comparisonChart comparing SPX and DJT.
This count has SPX and DJT in wave ((2)) of ((5)), with wave ((2)) of SPX as an expanded flat and wave ((2)) of DJT as a regular flat.
For SPX, wave B of the expanded flat ends up being 200% of wave A (nearly to the tic). For DJT, wave B of the regular flat ends up being ~90% of wave A.
If correct, would expect wave C to target March 2020 lows.
US500/SPX morning analysisBearish analysis of US500/SPX.
Weekly RSI with bearish divergence.
Median line of pitchfork remains untagged, implying move down towards October 2022 low.
Convergence of fib levels/resistance at 6123.9-6144.4; length of move from October 2022 low is the same length as move from March 2020 low to January 2022 high, ATH with near-perfect tag of 2 fib channel expansion projected from January 2022 high to Octobe 2022 low.
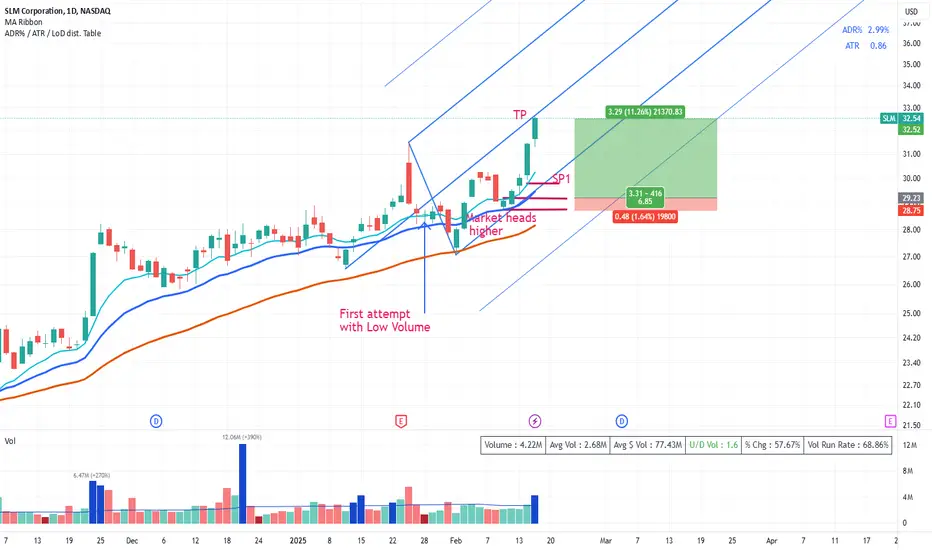
SLM Volatility contraction bar entry& Median Line ExitAfter a month of sideways price action over the turn of the year, we get a new price high on the on the back of poor earnings. Price held and a low volume narrow range bar shows up. I would expect there should be more selling here but minor volume day. Take a long but stopped a few days later.
However price comes back in early Feb after holding the 50EMA.
Try another squat bar buy stop entry.
Price target the ML as Dr. Andrews says, "Price makes it to the median line 80% of the time".
BNX - Finding Support, Resistance and Trade SetupsAfter yesterday's push to test the $1 level, BNX got hit with some rejections. Following the swing high SFP (Swing Failure Pattern), the price is down about 10%. Let's update our analysis with some key levels that clearly outline our support and resistance zones, and then we'll dive into the trade setups.
Support & Resistance Criteria
Resistance Levels
BNX faced rejection around the $1 mark, with the resistance zone clearly defined between $1.0137 and $1.0263
A short trade could have b
BShort
BNX Update: Where Is BNX Heading Next?UPDATE:
Price didn’t quite reach the 0.618 fib retracement level we initially eyed for a short entry, it got very close and then faced rejection off the pitchfork upper resistance trend line. This rejection triggered a sharp 13% drop down to a low of $0.8278. After a brief bounce, I'm still waiting for price to drop further toward the support zone at $0.8–$0.78. So far, the trade is unfolding as planned.
In addition, price has lost the VAL and daily support level, both now acting as resistanc
BShort
Two zones to long the SPX500Hello Traders, there are 2 zones that you can enter market.
the first one is between 5980 and 5950. If it coincides with Bollinger lower band, it could go up more sharply.
in that case top of red bearish channel could be considered as the 1st tp.
The 2nd option available after breaking the top zone, in reverse to 6132 we could enter the market again. Remember that again Bollinger band could help us to confirm the long trade. 6240 could be used as TP, as well as the higher band of Bollinger ban
NFP Incoming - Will SPX Smash 6100?NFP Incoming – Will SPX Smash 6100? | SPX Market Analysis 7 Feb 2025
The bulls keep charging as SPX edges closer to 6100. But with the NFP report dropping pre-market, things could get lively.
Will we blast through resistance or bounce back down? Expect some whipsaw chaos before the market settles – but with a bullish trend already in play, we should at least get one more push toward target exits before the dust settles.
---
SPX Deeper Dive Analysis:
📈 Bullish Move On Track
SPX has ridde