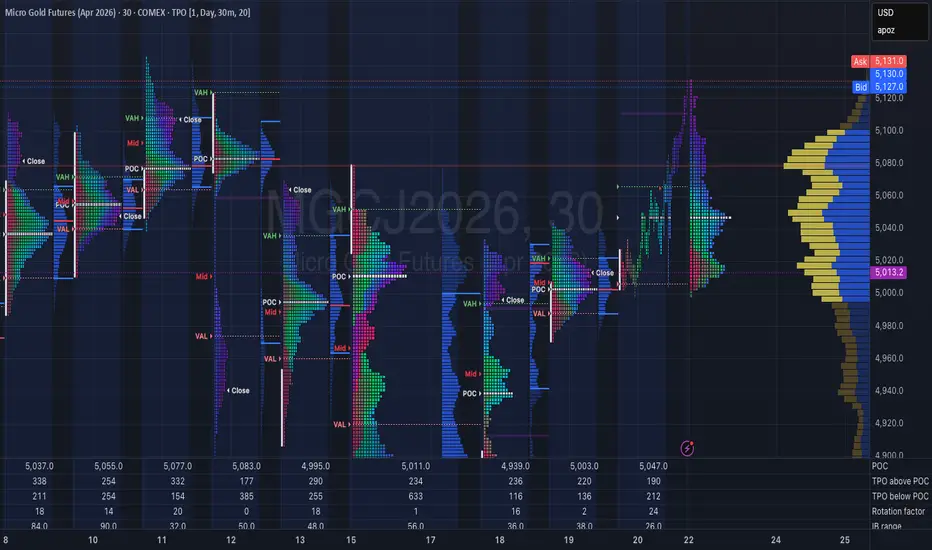
MGC Context: Weekly Structural Repair & The 5,000 Sentinel SiegeMGC Context: Weekly Structural Repair & The 5,000 Sentinel Siege
Related Tickers: COMEX_MINI:MGCG2026, COMEX:GC1!, CAPITALCOM:DXY
Weekly Recap (Feb 16 – Feb 20, 2026)
1. Market Context (Value Migration & Repair)
The auction transitioned from a defensive "washout" into a powerful Vertical Initiative phase mid-week.
• The Mid-Week Surge: Wednesday/Thursday successfully erased the previous liquidation.
• Structure: Multiple Single Print sequences confirm OTF Buyers are back. The auction repaired the structural damage and moved back into Price Discovery .
• Value Migration: Weekly POC has migrated higher to 4,975 , showing acceptance of higher prices.
2. GEX & Sentiment Analysis
• The Gamma Wall: 5,000 is the primary Call Resistance . It remains the ultimate upside sentinel.
• The Gamma Floor: 4,900 is the Put Support providing a mechanical floor.
• CMR/COT: Crowdedness has reset to Neutral (Optix 64) . COT shows high gross shorts—ripe fuel for a Short Squeeze .
Week Ahead Analysis (Feb 23 – Feb 27, 2026)
Fundamental Catalyst: Fed Minutes confirmed caution, but Greenland/Iran geopolitics keep the safe-haven floor solid.
Daytrade Plan (Monday, Feb 23)
• Bias: Neutral-Bullish above 4,975.
• Scenario 1: Acceptance above 5,000 targets 5,060+ .
• Scenario 2: "Look Above and Fail" at 5,005 targets rotation to 4,940 .
• Execution: No Overnight Trades. Flatten all by NY Close.
Talk to you for the next update.  Long
Long
GRTUSDT W-Pattern Signals Trend ReversalGRTUSDT is presenting a potential W-pattern (double bottom) reversal structure, with both Bottom 1 and Bottom 2 clearly defined on the chart. The second bottom formed with strong structural respect, indicating seller exhaustion and a shift in market control. This makes the Bottom 2 zone a strategic accumulation region, provided price continues to hold above this base.
The immediate resistance remains the pattern neckline, which also acts as the primary validation level for the bullish path. A sustained breakout and acceptance above this neckline would confirm the reversal structure and trigger a broader upside expansion. Notably, RSI has printed a clean double bottom at the exact same range as price, providing strong momentum confirmation and reinforcing the validity of the setup.
From a projection standpoint, the first technical objective sits around $0.463, aligned with the neckline level. A successful breakout beyond this zone opens the path toward higher timeframe targets at $2, with the extended upside objective positioned near the previous ATH region around $6. As long as structure remains intact, pullbacks should be viewed as corrective rather than trend ending.
This setup favors early positioning with controlled exposure, allowing room for volatility while maintaining alignment with the larger reversal thesis. Risk remains clearly defined below the accumulation base, while upside potential remains asymmetric if the neckline breakout materializes.  Long
Long
MGC Context: Vertical Initiative & The FOMC "Truth Serum" AuctioMGC Context: Vertical Initiative & The FOMC "Truth Serum" Auction
Related Tickers: COMEX_MINI:MGCG2026, COMEX:GC1!, CAPITALCOM:DXY
Analysis
1. Market Context (Vertical Initiative Phase)
Gold has transitioned into a powerful Vertical Initiative phase today.
• The Recovery: Rally has completely erased yesterday’s selling pressure which targeted the 4,900 shelf.
• The Structure: Profile is filled with Single Prints , signaling high-conviction Initiative Buying from OTF participants.
• The Behavior: One-time-framing higher as we repair the "Flash Crash" damage. Market is aggressively hunting for a new equilibrium.
2. Inventory & Nuance (Absorption & Gamma Resistance)
• The Sentinel: Approaching the 5,000 psychological handle. This remains the major Gamma Wall and key structural test.
• Inventory: Shifted to Initiative Long . The lack of TPO density at lower levels means the structural floor is "thin" until Acceptance is found at highs.
3. Fundamental Catalyst (The FOMC Minutes)
• FOMC Minutes: Releasing later today. This will decide if the rally has the legs to shatter the 5,000 sentinel or if it’s a late-stage trap.
Plan & Execution
• Bias: Ultra-Bullish Initiative above 4,950.
• The Play: Watch for Acceptance with Volume above 4,980 . Target extension toward 5,000–5,020 .
• Invalidation: Filling today’s single prints (trade below 4,930 ) kills the vertical momentum.
Talk to you for the next update.
Long 
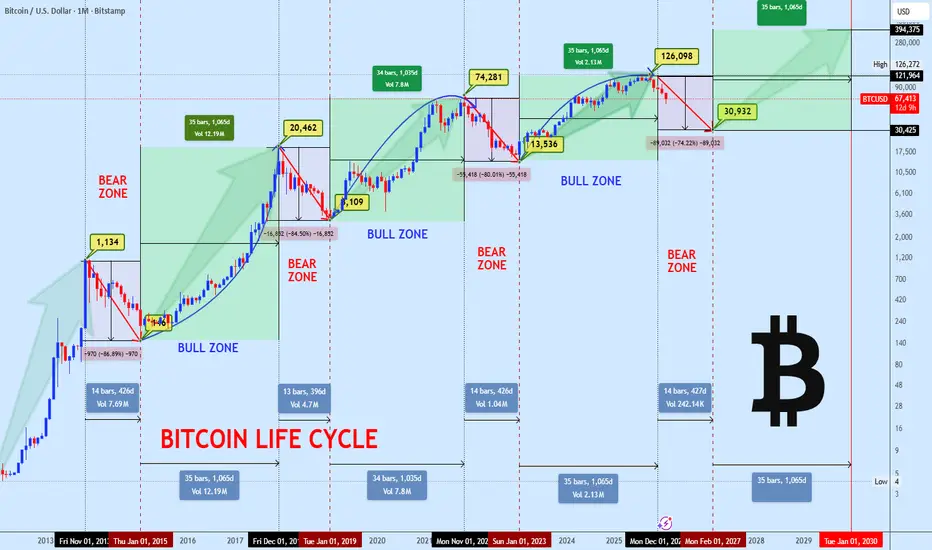
BITCOIN MACRO UPDATE LIFE CYCLE, STRUCTURE & PRICE LEVELSIt is timely to revisit the typical crypto market cycle, as Bitcoin continues to respect it with remarkable precision.
The macro top was confirmed in October, when BTC tested the $126,000 zone, marking the current cycle ATH. Since that rejection, price has transitioned into a prolonged consolidation phase, which structurally aligns with the early stages of a broader bear market cycle.
From a wave structure perspective, price action is developing an extended corrective formation (ABC). The initial decline from $126K to the $59K region completes Wave A. Current market behavior suggests a potential Wave B recovery toward the key supply and resistance band around $84,800–$90,000, where sellers are expected to reassert control.
Failure to reclaim and hold above this supply zone would likely trigger Wave C, with downside continuation toward the $34,000–$30,000 projected target area. This zone aligns with historical demand, prior cycle accumulation, and long-term value based interest making it a critical region for strategic accumulation, not panic.
Cycle analysis indicates that this corrective phase may extend into early 2027, setting the stage for the next major accumulation and recovery phase. While short- to mid-term volatility and downside risk remain valid, the broader macro structure continues to support higher prices long term, with expansion potential toward $200,000+ once the cycle reset completes.  Long
Long
 Short
Short
 Long
Long
 Short
Short
 Long
Long
Short 
 Short
Short
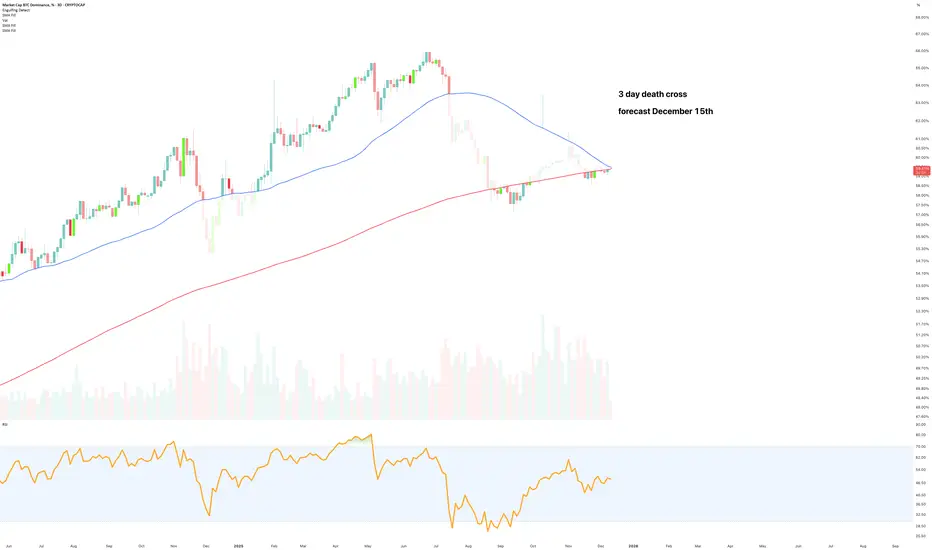
The alt-token Santa rally is here! - December 2025But it’ll be short lived. Many will mistakingly recognise this as “alt token” season, it’s not. It’ll be a relief rally on steroids for long suffering alt token holders. Use it as your exit from this awful asset class. This idea expires by the end of January 2026 at the latest, unless a development occurs that changes that outlook from the data available today.
The above 3 day chart of Bitcoin dominance forecasts a Death Cross print circa December 15th. Technically speaking, it is the 3rd three day Death cross to print on Bitcoin dominance. The others happened on May 2016:
At the time the OTHERS Total (first 100 alt tokens minus the top 10 generally speaking) rallied from $100m to $66billion over 590 days, when many made fortunes and watched them melt away in 2018. Today XRP has a market capital almost twice the size of the 2017 alt token bubble at $123billion. Aye.
The 2nd three day death cross was in August 2020, Bitcoin dominance rallied almost 30% on the cross and the OTHERS Total rallied 1000% over the following 255 days.
The take away, every 3 day death cross print is followed by a strong alt token performance.
“Wait wait you said until January 2026 and you present evidence for previous death cross resulting in alt token rallies that lasted multiple months, I’m confused!”
Why I know it won’t last long
A few of the long term followers among you may remember this idea “I mminent 2-day death cross - Is Bitcoin about to crash 30-40% ?? ” from 2022. The idea discusses the relevance of the 2 day death cross (not a 3 day as discussed above). That is when:
The 2 day 50 Simple Moving average (blue) crosses down the 2 day 200 SMA (Red) with price action under the 200 SMA.
If you look left you’ll notice every Bitcoin bear market is confirmed with this event. A 2 day death cross is forecast to print around the end of the month. It does not mean price action will drop like a vegan at a BBQ, but rather complain at first before being overcome by the stench of gravity.
Bitcoin 2 day death cross forecast, December 31st, 2026
Will not bore you with past crosses, you can do look them up yourself. What is clear, if not factual, a 2 day death cross is the start of a minimum year long bear market.
Conclusions
So yes, the alt token Santa rally is here, jingling its little bells and waving shiny green candles in your face like some bloke at a Christmas market trying to sell you socks you don’t need.
And like all Christmas magic, it’ll vanish the moment the lights go off. Not an “alt-season,” not a new paradigm, not “the big rotation we’ve been waiting for.” It’s one last sugar rush before the dentist arrives.
The real Grinch is waiting at the end of the month: the 2-day Bitcoin death cross, the one that actually matters. The one that says, “Right, fun’s over, pack it up, winter’s here.”
If you’re still clinging to low-cap jungle rubbish by February, that’s no longer optimism, that’s performance art. Use the rally. Exit the nonsense. Save yourself before the lights go out and the floor collapses faster than a crypto influencer’s moral compass.
Ww
Disclaimer
==========================================
This is not financial advice, obviously. If you read this and think, “Right, I’m putting the house, the kids, and the dog into ShibaBonk Inu because Santa said alt season!” that’s on you, mate.
If the market pumps, you’ll claim you’re a genius.
If it dumps, you’ll blame me. Either way, I’ll still sleep like a baby.
Do your own research.
Long 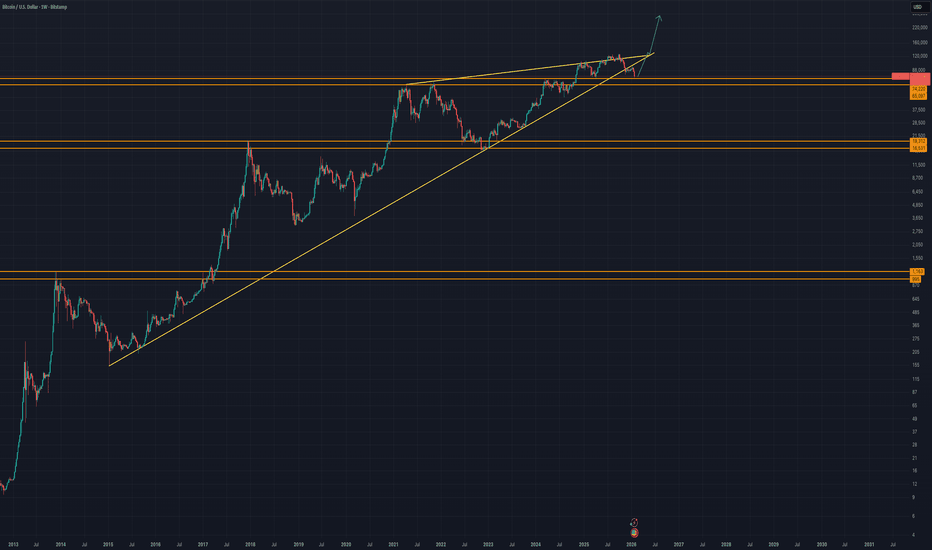
Long 
Long 
Long 

 Long
Long