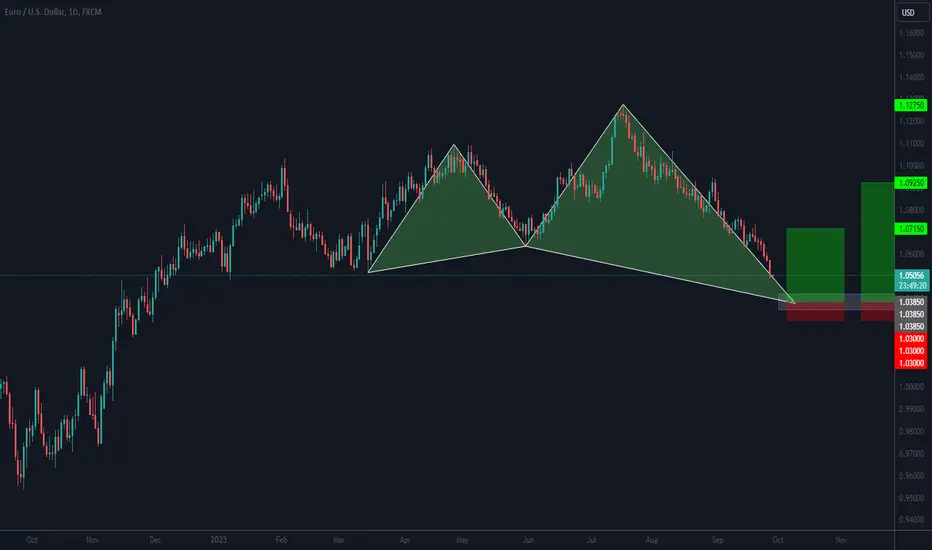
Long
Long
Golden Buying OpportunityTrading Gold and Oil. As you know, I typically trade these products on a longer-term perspective due to their volatility compared to the FX market.
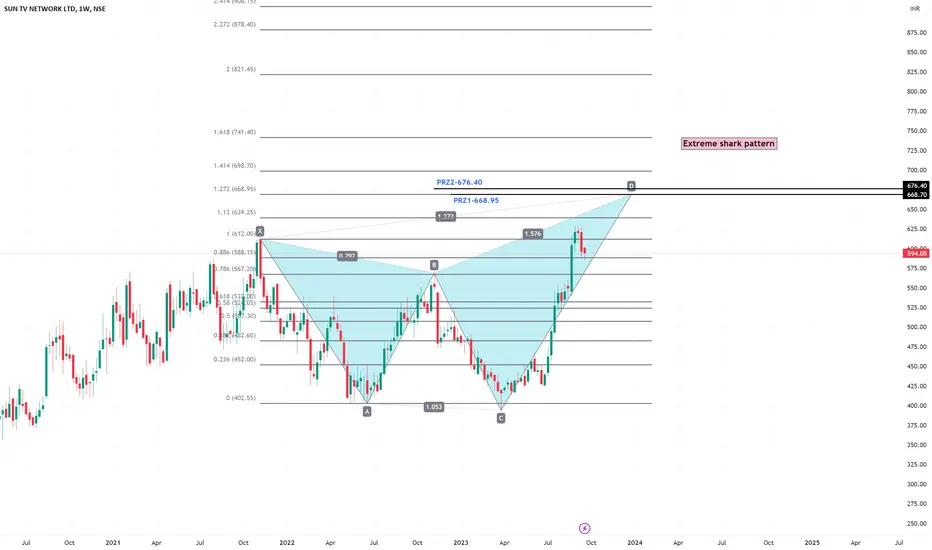
Recently, I have noticed a Bullish Shark Pattern confirmation on gold, which presents two potential approaches.
Option 1 would be to engage the trade immediately if there is a retest at $1,819.37. This is because the Shark Pattern has completed, and a retest could be an excellent opportunity to enter the market.
Option 2 would be to wait for a retest on the support level of the 1hourly chart at $1,814.97, as long as the market doesn't close below $1,810.12.
Alternatively, if you are interested in shorting opportunities, the sell zone on the 4-hourly chart could be an opportunity for you.
Which option do you think would be the best approach? Long 
This is the kind of Trading Setup that I go Aggressive!The Bullish Shark Pattern is yet to be confirmed, but it went lower than PRZ, which is seen as a warning sign for most. However, I see it as an opportunity that I don't want to miss out on.
Here are some key points that I wanted to highlight:
- The Terminal Bar produced a long shadow that provided Cover Support, which means that the level is not broken.
- On the 1-hourly chart, we can see RSI divergence.
- There's a sideway bounce setup on the 4-hourly chart, which can be attributed to a combo trade.
As you know, I'm a nurtured conservative trader, but once I see an opportunity like this, I turn into an aggressive trader. So, I'm quite excited about this.
What's your take on this? Beware of Shorting OpportunitiesAs we continue to analyze the market, it's become clear that avoiding bad trades is just as important as finding the next big one. This is particularly true when looking at the bottom 2 charts of NZDJPY's daily and weekly charts.
On the daily chart, we can see that the Bearish Deep Gartley Pattern is over-extended, meaning it took longer than expected to complete the trading setup. As a result, the market may not respect the level and could bash through the resistance level.
On the weekly chart, we also see that the Bearish Shark Pattern retest, doesn't give us an RSI divergence. Once again, the market may extend further before any significant retest.
Despite all of this, if you're still interested in shorting the market, do it with caution.
On the 4-hourly chart, waiting for the market to retest at the 90.03 level could attract price-action traders to jump in for the counter-trend move.
Personally, I prefer to head in for a buying opportunity at the key support level of 89.05. My initial stop-loss would be at 88.67 (-38 pips) or approximately -380USD/lot. The first target is seen at 90.08 (+103pips) or approximately 1,030USD/lot.
Remember, it's important to plan your own trade and never follow any trader blindly. Let's continue to monitor the market closely and make informed decisions.  Short
Short
Short 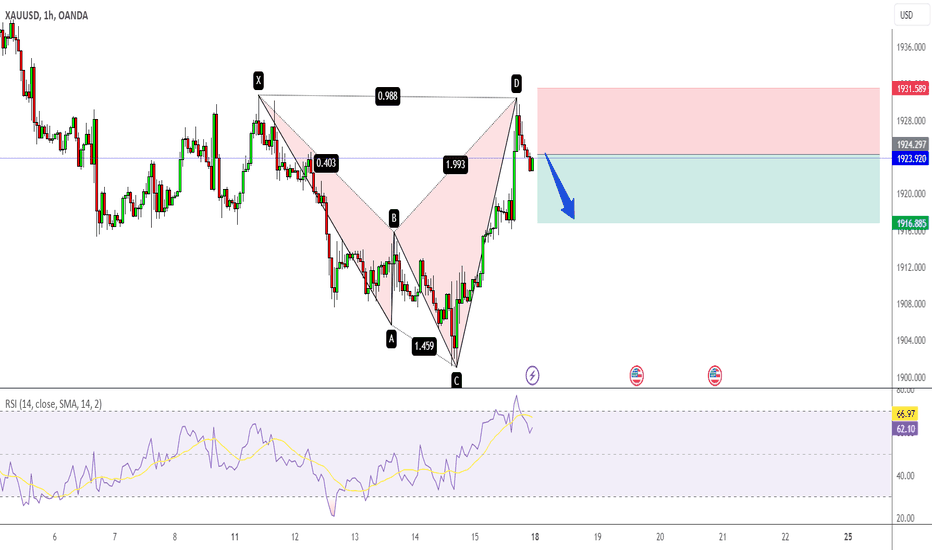
 Long
Long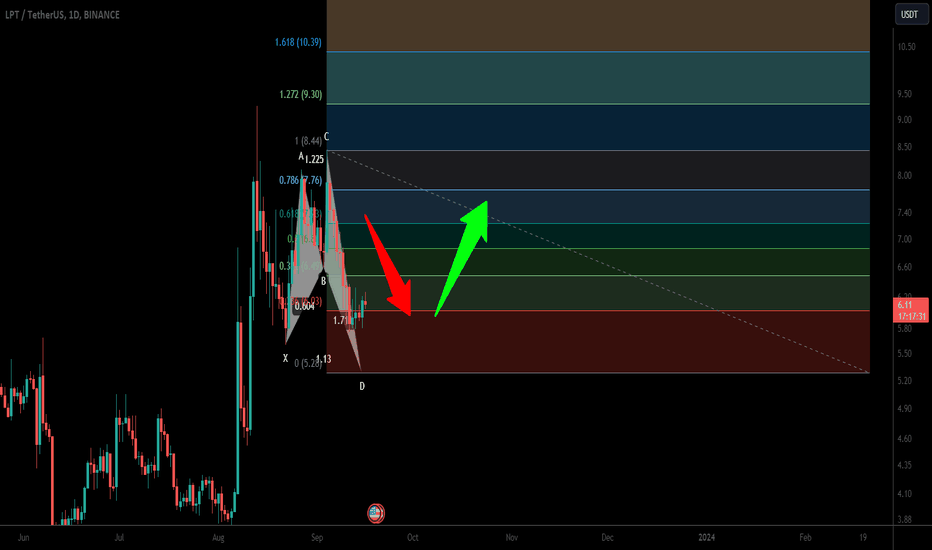
 Short
Short
 Short
Short