XAUUSD: Bullish Wave 5 Targets HigherGold is showing a clear bullish recovery after breaking away from the lower accumulation base. From Kelly’s view, the current structure suggests that XAUUSD is no longer only moving sideways; buyers are trying to build a larger Elliott Wave continuation towards the upper Fibonacci target.
The key idea is simple: gold remains bullish, but after a strong push, the better setup is to wait for a controlled pullback before following the next upside wave.
⟡ Market structure
The chart shows gold pre
Trend Line Break
XAUUSD: Bullish Continuation Above 4,285
Gold is still showing strong bullish momentum after breaking away from the previous consolidation structure. From Kelly’s view, the market is now building a clearer Elliott Wave recovery, and the current setup suggests that price may continue higher if the pullback holds above the 4,285–4,300 buy zone.
The key idea is simple: gold is bullish, but the better plan is to wait for a healthy correction before following the next upside wave.
⟡ Market structure
The chart shows gold has made a stro
GOLD - Local bullish sentiment. NFP coming upFollowing a strong rally, ICMARKETS:XAUUSD has entered a consolidation phase, signaling the potential for further upside if buyers can successfully defend the 4300 level.
The U.S. Dollar Index has broken its bullish structure, although the broader fundamental backdrop remains mixed. Geopolitical uncertainty persists, while the Federal Reserve continues to maintain a hawkish stance.
After the recent advance, gold is consolidating and building a liquidity pool around the 4242–4229 zone, wh
XAUUSD: ABC Pullback Before the Next Bullish Move
Gold has just made a strong upside move and is now showing signs of short-term exhaustion near the upper area. From Kelly’s view, the main trend is still constructive, but price may need a corrective ABC pullback before the next bullish continuation becomes cleaner.
The key idea is simple: gold is still bullish, but buying after a correction is safer than chasing near the top.
⟡ Market structure
The chart shows gold pushed strongly from the 4,150–4,160 area and completed a short-term Elliot
Gold Braces for NFP VolatilityResistance
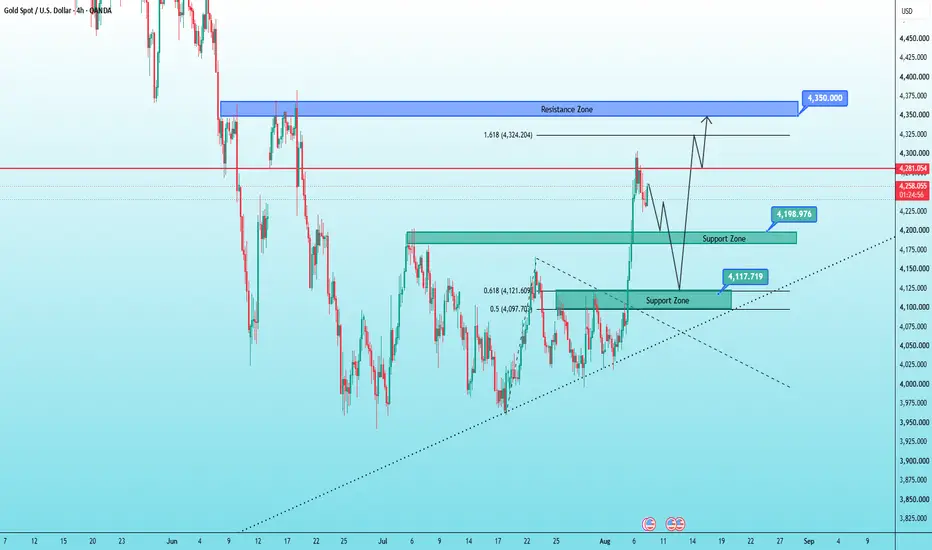
🔴 **Nearest Resistance: 4,281 – 4,300**
* This is the price zone where the recent strong rally was rejected.
* If price revisits this area and forms a bearish reversal candlestick pattern (such as a Pin Bar or Bearish Engulfing), the probability of a pullback will increase.
🔵 **Major Resistance: 4,340 – 4,357**
* This is a key Supply/Resistance zone identified on the chart.
* It is also close to the **1.618 Fibonacci Extension level (4,324)**.
* If price breaks above 4,300, the ne
GBPUSD | 1D Technical Structure AnalysisThe daily chart is approaching an important technical area where trendline resistance, a 1D Order Block (OB), and previous swing structure are interacting. Price is currently testing a key decision zone that could influence the next directional move.
🔍 Key Observations
✅ Price is approaching a descending trendline resistance.
📉 The market is attempting to recover after a previous liquidity sweep (LQ Sweep).
🟩 A 1D Order Block (OB) below current price remains a notable support area.
🟦 A higher-
BTCUSD | 1H Technical Structure AnalysisThe 1H chart continues to show a constructive market structure following a clear Market Structure Shift (MSS). Since then, price has respected an ascending channel, printing a series of higher highs and higher lows. 📊
🔍 Key Observations
✅ Bullish market structure remains intact.
📈 Price is trading within a well-defined ascending channel.
🟧 The lower channel boundary is the first area to monitor for buyer interest.
🟦 A higher-timeframe 1H Fair Value Gap (FVG) overlaps with a 1H Order Block (OB)
ETHUSDT - Ready for Continued GrowthBINANCE:ETHUSDT is consolidating above 1898 following a distribution phase. From a technical perspective, the daily structure remains constructive, with ETH showing relative strength compared to Bitcoin, which increases the probability of further upside
Bitcoin is gradually recovering and approaching the key 65,150 trigger level. A breakout above this zone could provide additional support for the broader crypto market.
Against this backdrop, Ethereum has broken out of its local bearish cor
XAUUSD: Waiting for Wave 5 Buy Setup
Gold is showing a strong bullish continuation after breaking above the previous resistance structure. From Kelly’s view, the market has already built a clear recovery wave, and the current price action suggests that XAUUSD may only need one corrective pullback before continuing higher into the next Elliott Wave target.
The key idea is simple: gold is bullish, but the best setup is still to wait for a clean buy zone reaction instead of chasing after a sharp rally.
⟡ Market structure
The char
XAUUSD 30M Market Outlook | Order Block & Price ActionGold is currently trading near the 4,057 area after reacting from the lower demand zone and moving into a short-term consolidation phase. The chart highlights important Order Block zones, Market Structure Shifts (MSS), and key liquidity areas that may influence the next price movement.
The current structure suggests that price may continue consolidating between the nearby support and resistance levels before a clearer directional move develops. The projected bullish scenario is based on a possib
GOLD - A short squeeze could lead to a correction ICMARKETS:XAUUSD is advancing during the Asian session as part of a distribution phase, testing the 4166–4195 resistance zone. The move is being driven by Western comments regarding negotiations in the Middle East. However, Iran has yet to respond, leaving geopolitical uncertainty elevated.
The U.S. dollar remains in consolidation following last week's decline, which was largely triggered by intervention in the Japanese yen. Gold showed little reaction to the weaker dollar and continued tr
Bikaji Foods International Ltd. – Multi-Timeframe BreakoutBikaji Foods is approaching a high-conviction technical setup, where a short-term Ascending Triangle is attempting to break out while price simultaneously challenges a long-term descending trendline.
The stock has spent several months consolidating after a prolonged correction, forming higher lows against a relatively flat resistance. This compression indicates that buyers are gradually absorbing supply. A decisive breakout above both the triangle and the long-term trendline could signal the be
XAUUSD: Wave 4 Pullback Before Wave 5
Gold is showing a bullish recovery structure after reacting strongly from the lower support area. From Kelly’s view, the current chart suggests that XAUUSD is now moving through wave 4 correction, and if this pullback holds above support, the next bullish wave may continue towards the Fibonacci resistance zone.
The key idea is simple: gold is still building an upward structure, but buyers need to defend the wave 4 zone before wave 5 can develop cleanly.
⟡ Market structure
The chart shows go
NZDUSD - Ready for growth within the trend Following a strong rally, FX:NZDUSD is now retesting the former resistance of its trading range, which has turned into support. This creates an opportunity for the bullish trend to continue.
The U.S. Dollar Index has broken its recent market structure, and continued dollar weakness could provide additional support for the pair
From a technical perspective, NZDUSD is performing a classic support retest within its countertrend recovery, while buyers are actively defending the 0.5863 level.
EURJPY - Long squeeze on support amid a bullish trend FX:EURJPY has fallen sharply following the Bank of Japan's intervention, triggering a long squeeze below key support. A recovery back into the trading range could provide the foundation for a bullish rebound
The market is currently stabilizing after the sharp decline, with price testing what was previously the daily range support, now acting as resistance.
A move back above the 180.80 level, followed by sustained consolidation, would confirm the recent breakdown as a false breakout and could t
Gold Is Trading Sideways, Awaiting Key Economic News.XAUUSD Technical Analysis (H1)
Price continues to trade within a symmetrical triangle pattern, with the long-term descending trendline still capping the upside momentum. At the moment, price remains above the key support zone but lacks sufficient momentum for a breakout, indicating that the market is still in a consolidation phase before the next directional move.
Key Resistance
🔵 4,095 – 4,100 – Immediate resistance, aligned with the long-term descending trendline and acting as the key decis
How Will Gold Perform at the Start of the New Week?XAUUSD Technical Analysis (H1)
Based on the chart, price is consolidating above a key support zone while forming a Higher Low structure, although it remains under pressure from the long-term descending trendline. The trading range is gradually narrowing, suggesting that the market may be approaching a significant volatility breakout.
Trend
* Short-term: Neutral with a bullish bias.
* Price continues to hold above the 4,040 – 4,046 support zone, indicating that buyers are defending the bullish
EURUSD | Retracement Into HTF Premium ZoneOverview
EURUSD is recovering after a recent decline and is approaching higher-timeframe resistance. While short-term momentum has shifted upward, price is moving toward areas where multiple technical confluences exist, making this a location to monitor for potential reactions rather than assuming continuation.
Higher Timeframe Structure
The broader market structure remains corrective following the previous bearish shift. Price is currently retracing into premium pricing where several technic
XAUUSD: Bullish Wave Structure Is Building
Gold is trying to rebuild bullish momentum after defending the lower reaction area near 4,050. From Kelly’s view, the chart is showing an early Elliott recovery structure, but buyers still need confirmation above the short-term resistance before the next upside wave becomes stronger.
The key idea is simple: gold is recovering, but the clean bullish continuation needs price to hold above support and confirm the next wave 4 base.
⟡ Market structure
The chart shows gold previously rejected fro
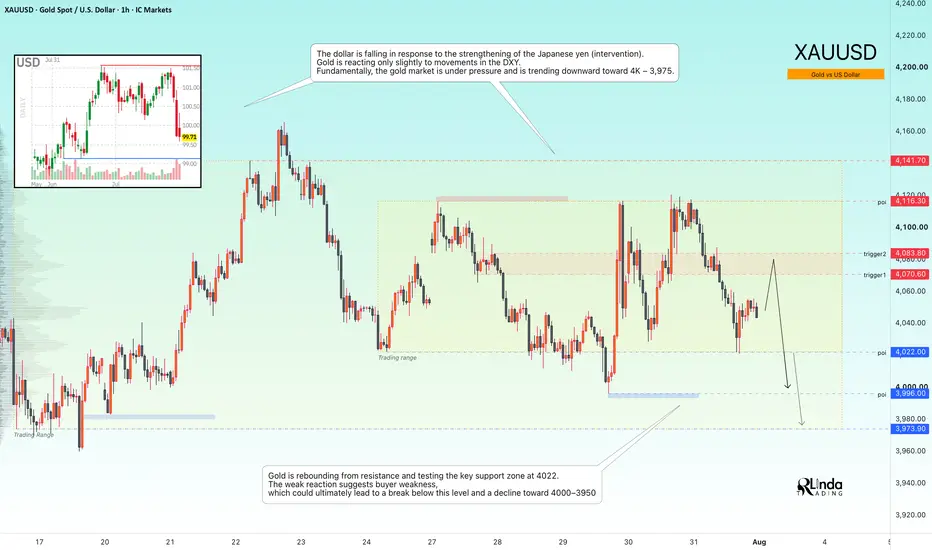
GOLD - Consolidation Amid a Bearish Trend ICMARKETS:XAUUSD remains trapped within the 4022–4116 trading range as markets await the next major economic catalysts. From a technical perspective, however, the broader bearish trend continues to dominate
The U.S. dollar has weakened following renewed strength in the Japanese yen, driven by intervention efforts. Despite this, gold has shown only a muted response to the decline in the DXY. Fundamentally, the metal remains under pressure, with the market still favoring a move toward the 40
The Liquidity Cycle: IRL (FVG) to ERL (Swings) MasterclassICT, IRL, and ERL Explained (Beginner Guide)
Trading concepts can often seem overwhelming to new traders. In this chart, we break down three fundamental components of ICT (Inner Circle Trader) methodology—IRL and ERL—in the simplest way possible.
1. What is ICT?
ICT (Inner Circle Trader) is a trading methodology focused on tracking institutional order flow. Instead of relying on traditional retail indicators, ICT focuses on how central banks and large market makers manipulate price to target
Bearish Ascending Triangle pattern for TRXUSDT on Dailywe can see that clearly on Chart that TRXUSDT forming a clear bearish ascending triangle on Basic Chart Pattern Theories.
Lookin for entry if you notice that TRX forming a weak candle, we can sell on weakness. As always use proper money management and Trade Wisely guys. Happy Profit :)
XAUUSD: Weekly Elliott Wave May Need One More LowGold is still trading under the larger downtrend structure, and the weekly chart has not confirmed a full bullish reversal yet. From Kelly’s view, the current market is moving sideways above key support, but as long as price remains below the descending trendline and the 4,201 resistance area, the bearish Elliott structure still needs attention.
The key idea is simple: gold may continue lower first to complete the final Elliott wave, then a larger ABC recovery may appear later if buyers defend
GOLD - The bearish trend continuesICMARKETS:XAUUSD remains in a medium-term bearish trend. The recent attempt to break above 4116 failed, and the market has once again transitioned into a selling phase
Gold is currently caught between geopolitical tensions, which tend to strengthen the U.S. dollar, and expectations surrounding upcoming central bank decisions. The next directional move will largely depend on developments in the Middle East and signals from the Bank of Japan. A continued hawkish stance from the Federal Reserve