Short
Short
XAUUSD — Bullish Channel Holds Above Buy Zone
Fundamental Analysis
Gold is still reacting to USD momentum, Treasury yields, and upcoming U.S. macro data. For now, the short-term structure remains positive while price continues to hold inside the rising channel.
Technical Analysis
On the 2H chart, XAUUSD is trading around 4,142 and still respecting the bullish channel structure. The main buy order trendline zone is around 4,141 - 4,143. If price holds this area, buyers may continue to defend the trend and push gold toward the liquidity zone at 4,144, then the mid-channel resistance around 4,145 - 4,146. A stronger breakout above this area may open the way toward the main target around 4,152.
Important Key Levels
Current price: 4,142
Main buy zone: 4,141 - 4,143
Short-term support: 4,140
Liquidity resistance: 4,144
Mid-channel resistance: 4,145 - 4,146
Main target: 4,152
Invalidation: below 4,140
Trading Scenario
Main Buy Setup
Entry: 4,141 - 4,143
Stop Loss: 4,140
Take Profit 1: 4,144
Take Profit 2: 4,145 - 4,146
Take Profit 3: 4,152
Buy Condition
Wait for gold to retest the 4,141 - 4,143 buy zone and show bullish rejection. A clean hold above the trendline keeps the bullish setup valid. If price breaks above 4,144, upside momentum becomes stronger toward 4,145 - 4,146 and 4,152. If price breaks and holds below 4,140, the buy setup is invalid.
Overall View
XAUUSD remains bullish while price stays inside the rising channel and holds above the buy order trendline zone. The preferred plan is to wait for confirmation around 4,141 - 4,143, then look for continuation toward 4,144, 4,146, and 4,152.
Do you share the same bullish view on gold, or are you waiting for confirmation above the liquidity zone first?
 Short
Short
MASON XAUUSD – Bullish Pullback Before Mid-Term Rally
XAUUSD is trading around 4,123 after recovering from the short-term correction zone. Price is still holding above the main uptrend trendline, while the current pullback is moving around the Fibonacci reaction area.
The priority view remains bullish in the medium term, as long as gold continues to hold above the buy order zone and the rising trendline support.
Technical View
Gold is still moving inside a bullish recovery structure. The higher low formation from the previous support area shows that buyers are still defending the market, even though price is currently correcting below the short-term descending trendline.
The most important point on this chart is the uptrend trendline. Price has respected this trendline several times, which means the broader bullish structure remains valid while gold stays above it.
The 4,101–4,106 area is the main buy order zone. This zone is important because it aligns with the Fibonacci correction area, the rising trendline support, and the previous reaction zone. If gold pulls back into this area and holds, it may confirm another higher low before the next bullish leg.
Short term, price may still face resistance around 4,138 and 4,159. The 4,159 area is marked as a sell order zone, so some rejection or consolidation may appear there first. However, if gold breaks and holds above 4,159, the bullish structure may open a stronger move toward the 4,203 resistance.
Ichimoku also supports the idea that the market is trying to recover. Price has moved back near the Ichimoku structure, and if buyers can keep price above the cloud support, the next medium-term bullish continuation will become more convincing.
Key Zones
Current price: 4,123
Buy order zone: 4,101–4,106
Trendline support: 4,095–4,106
Short-term resistance: 4,138
Sell order reaction zone: 4,159
Major resistance: 4,203
Ichimoku support area: 4,067–4,101
Invalidation: below 4,067
Trading Plan
Buy Priority: 4,101–4,106
Condition: wait for bullish rejection, higher low formation, or price holding above the uptrend trendline and Fibonacci support area.
SL: below 4,067
TP1: 4,138
TP2: 4,159
TP3: 4,203
Alternative Scenario
If gold breaks above 4,159 directly, wait for a retest of this zone as support before looking for buy continuation toward 4,203. A clean hold above 4,159 would confirm stronger bullish momentum for the medium-term move.
Sell View
Sell is not the priority while price stays above the uptrend trendline and the 4,101–4,106 buy order zone. A short-term sell reaction may appear around 4,159, but it should only be treated as a correction unless gold breaks below 4,067.
Final View
Overall, gold remains in a bullish structure. The current movement looks more like a Fibonacci correction before continuation rather than a full bearish reversal. The cleaner plan is to wait for price to hold the 4,101–4,106 buy zone, then follow the next bullish leg toward 4,138, 4,159, and potentially 4,203.
Will gold respect the Fibonacci buy zone and start the next bullish leg, or retest the trendline support first?
Long 
EURUSD — Bearish EMA Trend, Sell From Fibonacci Value ZoneEURUSD — Bearish EMA Trend, Sell From Fibonacci Value Zone
Fundamental Analysis
EURUSD remains under pressure as traders continue to watch USD momentum, Fed expectations, and upcoming macro data.
For now, the main structure still favours sellers while price trades below the higher EMA resistance zone. Any recovery should be viewed as a corrective pullback unless EURUSD can reclaim the main sell zone with strong confirmation.
Technical Analysis
On the 2H chart, EURUSD is still moving in a bearish structure. EMA 34, EMA 89, and EMA 200 remain positioned above the key recovery area, showing that the main trend is still controlled by sellers.
Price is currently around 1.1417 after a short-term rebound from the lower area. However, this recovery is moving toward the Fibonacci value zone, where sellers may look for continuation entries.
The first reaction zone is around 1.1435 - 1.1440, where price has already tested the Fibonacci area. The stronger sell zone is around 1.1458 - 1.1474, which aligns with Fibonacci retracement, previous structure, and EMA resistance.
If price reaches this sell zone and rejects, the bearish continuation scenario remains valid. The main downside target is the Fibonacci extension zone around 1.1297.
Important Key Levels
Current price area: 1.1417
Fibonacci reaction zone: 1.1435 - 1.1440
Main sell price zone: 1.1458 - 1.1474
EMA resistance area: 1.1474 - 1.1490
Short-term support: 1.1390 - 1.1360
Fibonacci target: 1.1297
Invalidation area: above 1.1490
Trading Scenario
Main Sell Scenario
Entry: 1.1458 - 1.1474
Stop Loss: 1.1490
Take Profit 1: 1.1390
Take Profit 2: 1.1360
Take Profit 3: 1.1297
Sell Condition
The preferred setup is to wait for EURUSD to recover into the 1.1458 - 1.1474 sell zone. This area is important because it combines Fibonacci retracement, EMA resistance, and previous bearish structure.
A sell setup becomes more valid if price forms bearish rejection from this zone, such as a long upper wick, bearish engulfing candle, failed breakout, or lower high below the EMA structure.
If price rejects from the sell zone and breaks back below 1.1390, the bearish continuation view becomes stronger. The next downside focus would be 1.1360, followed by the Fibonacci target around 1.1297.
Alternative Buy Scenario
Entry: 1.1390 - 1.1400
Stop Loss: 1.1360
Take Profit 1: 1.1435
Take Profit 2: 1.1458
Take Profit 3: 1.1474
Buy Condition
This is only a short-term corrective bounce setup, not the main trend view. A buy setup is valid only if EURUSD holds above 1.1390 and forms clear bullish rejection.
If price fails to hold this area, the bounce setup is invalid and sellers may push directly toward the Fibonacci target zone.
Entry Conditions
Wait for price to retest 1.1458 - 1.1474.
Look for bearish rejection before entering sell.
Do not sell aggressively at the low without a pullback.
A break below 1.1390 confirms stronger downside pressure.
If price breaks and holds above 1.1490, the sell setup is invalid.
Overall, the main view remains bearish while EURUSD trades below the EMA resistance structure. The preferred plan is to wait for a corrective pullback into the Fibonacci value zone, then look for sell confirmation toward 1.1390, 1.1360, and the Fibonacci target around 1.1297.
Do you share the same bearish view on EURUSD, or are you waiting for a cleaner rejection from the Fibonacci value zone first?
XAUUSD — Bullish Setup Holding Above Buy Zone
Fundamental Analysis
Gold is still reacting to USD momentum, Treasury yields, and upcoming U.S. data. For now, the short-term structure remains positive while buyers continue to defend the recovery trend.
Technical Analysis
On the 1H chart, XAUUSD is trading around 4,100 and holding above the rising trendline. The key buy order zone at 4,087 - 4,092 is acting as the main value area. If price holds this zone, the bullish structure can continue toward the day high at 4,118, then the liquidity area around 4,134. A stronger breakout may open the way toward 4,168 - 4,180.
Important Key Levels
Current price: 4,100
Buy zone: 4,087 - 4,092
Short-term support: 4,054
Day high: 4,118
Liquidity target: 4,134
Main target: 4,168 - 4,180
Invalidation: below 4,054
Trading Scenario
Main Buy Setup
Entry: 4,087 - 4,092
Stop Loss: 4,054
Take Profit 1: 4,118
Take Profit 2: 4,134
Take Profit 3: 4,168 - 4,180
Buy Condition
Wait for price to retest 4,087 - 4,092 and show bullish rejection. A clean hold above this zone keeps the bullish setup valid. If price breaks above 4,118, upside momentum becomes stronger. If price breaks and holds below 4,054, the buy setup is invalid.
Overall View
XAUUSD remains bullish while price holds above the rising trendline and the 4,087 - 4,092 buy zone. The preferred plan is to wait for confirmation from the value area, then look for continuation toward 4,118, 4,134, and 4,168 - 4,180.
Do you share the same bullish view on gold, or are you waiting for confirmation above the day high?
Long 
XAU/USD Bullish Reversal Setup | 4H Trendline Break Opportunity
Gold is currently trading within a broader bearish market structure, but price is approaching a key demand/support zone where buyers may attempt to regain control. The descending trendline continues to act as dynamic resistance, making the next reaction around this area important.
The current expectation is for price to hold above the highlighted support zone and produce a bullish breakout above the descending trendline. A confirmed break and close above this trendline would strengthen the bullish outlook and could trigger momentum toward the first resistance around 4,383, which also represents the first take-profit area.
If buyers maintain control above that resistance, the next upside objective is near 4,554, where a major higher-timeframe target is located. The marked order block around 4,208–4,257 may act as an intermediate resistance before price continues higher.
However, this bullish scenario remains valid only while price respects the highlighted support. A decisive breakdown below the support and selling liquidity zone would invalidate the setup and could lead to further downside.
Key Levels
Support: 4,045–4,060
Order Block: 4,208–4,257
First Target: 4,383
Final Target: 4,554
Educational Note:
This analysis is based on Smart Money Concepts (SMC), including market structure, trendline analysis, order blocks, liquidity, and support/resistance. Always wait for confirmation before entering a trade and apply proper risk management. This analysis is for educational purposes only and should not be considered financial advice. Long 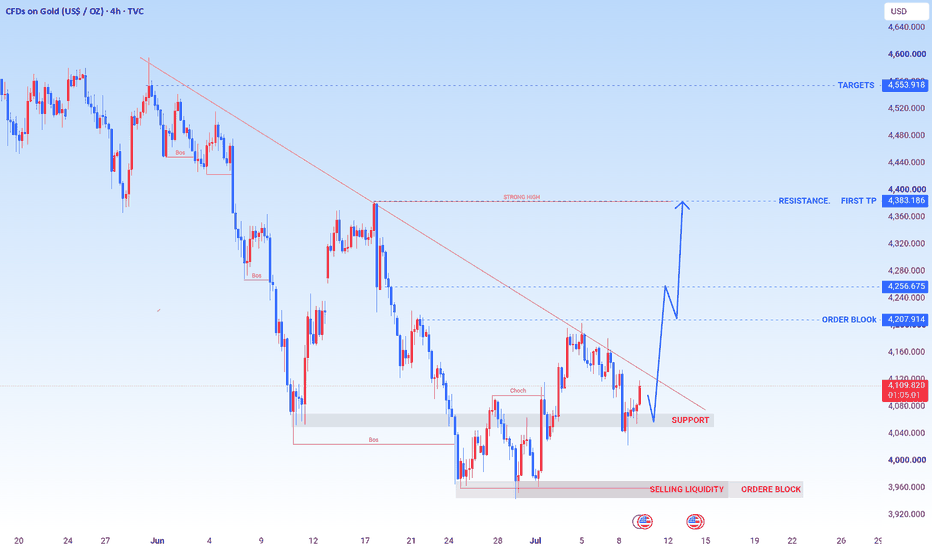
XAUUSD: Wave 5 Downside May Continue From the Sell Zone
Gold is still trading inside a corrective bearish structure after failing to hold the earlier recovery momentum. From Kelly’s view, the current chart suggests that price may still be developing wave 5 lower, with the sell zone around 4,125–4,135 acting as the key resistance area.
The key idea is simple: gold is not showing a clean bullish continuation yet. As long as price stays below the sell zone, the wave 5 downside scenario remains active.
⟡ Market structure
The chart shows gold moving inside a descending channel after the previous strong upside move completed near the upper range. Price has already broken below the short-term rising trendline, then retested the lower resistance area without creating a strong bullish recovery.
The current reaction around 4,125 is important because price is sitting directly under the sell zone wave 5. If sellers continue to defend this area, gold may rotate lower again towards the support around 4,092 first.
Below that, the larger zone around 4,055–4,065 remains the main area where the Elliott 5-wave structure may complete.
➤ Key levels
◌ 4,125–4,135: sell zone wave 5 and short-term resistance
◌ 4,092: nearest support and first downside checkpoint
◌ 4,055–4,065: Elliott wave 5 completion zone
◌ 4,140: area where the sell setup begins to weaken
◌ Above 4,150: area where the bearish wave count needs reassessment
⌁ Elliott Wave view
From an Elliott Wave perspective, gold appears to be forming the final part of a bearish 5-wave decline inside the short-term channel.
Wave 1 started after price lost momentum from the upper range.
Wave 2 created a corrective rebound but failed to reclaim resistance.
Wave 3 pushed lower towards the 4,090 area.
Wave 4 is now reacting back into the sell zone.
If the sell zone holds, wave 5 may continue lower towards 4,055–4,065.
This is why Kelly would not chase buy while price remains below resistance. The current bounce still looks corrective unless buyers reclaim the sell zone with strength.
▸ Trading scenario
Preferred scenario: wait for price to reject from the 4,125–4,135 sell zone before expecting wave 5 continuation.
Sell zone: 4,125–4,135 if bearish confirmation appears
Stop loss: above 4,150 or above the confirmed rejection high
Take profit 1: 4,092
Take profit 2: 4,065
Take profit 3: 4,055 if wave 5 expands fully
Alternative scenario: if gold breaks above 4,150 and holds with strong acceptance, the bearish wave 5 setup weakens. In that case, price may need a new short-term structure before the next direction becomes clear.
⌁ Kelly’s view
For Kelly, this remains a sell-the-retest structure. Gold is still trading below the sell zone, and the Elliott count still allows one more downside leg before the full correction ends.
The cleaner plan is to wait for rejection around resistance, not sell blindly at support.
Gold is still under short-term pressure.
If 4,125–4,135 holds, wave 5 may continue towards the lower completion zone.
Share your view below.
Short 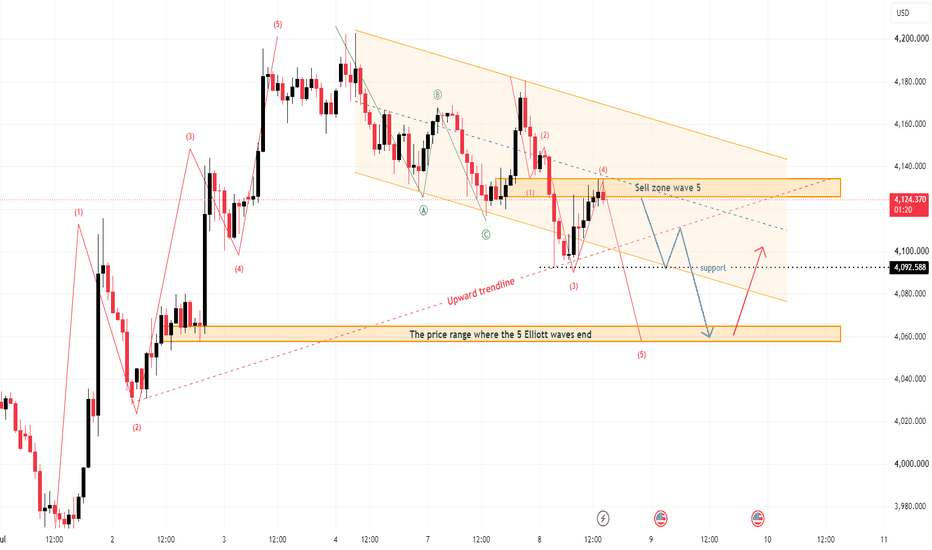
EURUSD - Retest of support at 1.143–1.140 before distribution FX:EURUSD is showing early bullish signals. The pair is breaking above the 1.1434 resistance cluster and the descending trendline, opening the door for a potential continuation higher
The latest FOMC minutes did not deliver a clear hawkish message, with markets pricing in only a 25–30% probability of a July rate hike. Meanwhile, the 1.1400 support continues to provide a solid base for a technical rebound. However, renewed geopolitical tensions in the Middle East continue to support the U.S. dollar as a safe-haven asset
The ECB is widely expected to remain on hold in July, while the Fed still retains the option of another rate hike. Technically, the U.S. dollar is showing a limited reaction to recent news and appears vulnerable to a corrective pullback, which could provide additional support for the euro following the false breakout below support and the breakout above consolidation resistance
Resistance levels: 1.1477, 1.1528
Support levels: 1.1434, 1.1400
The pair is also confirming a false breakout below the major weekly (W1) support. The prolonged battle around 1.1400 highlights persistent buying interest. Locally, EURUSD is breaking above the 1.1434 consolidation resistance and the descending corrective trendline. If bulls can hold 1.1434 as new support, the pair could extend its advance toward 1.1478 and 1.1528
Best regards,
R. Linda GOLD - Breakdown from consolidation. Bearish pressureFX:XAUUSD failed to extend last week's rally despite the temporary improvement in the fundamental backdrop. Following yesterday's geopolitical escalation, market sentiment has shifted again, putting renewed pressure on the metal
Gold recovered modestly on Wednesday after its recent decline, but gains remain limited by the stronger U.S. dollar. Market attention is now focused on the minutes from the June FOMC meeting, which could provide further clues about the Fed's rate outlook.
Additional pressure comes from renewed tensions between the U.S. and Iran and rising oil prices, both of which have reinforced inflation concerns. As a result, markets have increased the probability of a September Fed rate hike to 63%. Gold's next move will likely depend on both the FOMC minutes and further developments in the Middle East
Resistance levels: 4123, 4133, 4195
Support levels: 4090, 4030, 3960
Technically, after breaking out of its consolidation range, gold is now forming a countertrend correction toward a liquidity zone while producing a false breakout above resistance. Bears are attempting to defend the 4120–4130 resistance area. A consolidation below 4120–4130 could trigger another decline toward 4090, 4030, and 3959, as selling pressure continues to build within both the local and the broader bearish trends
Best regards,
R. Linda Short 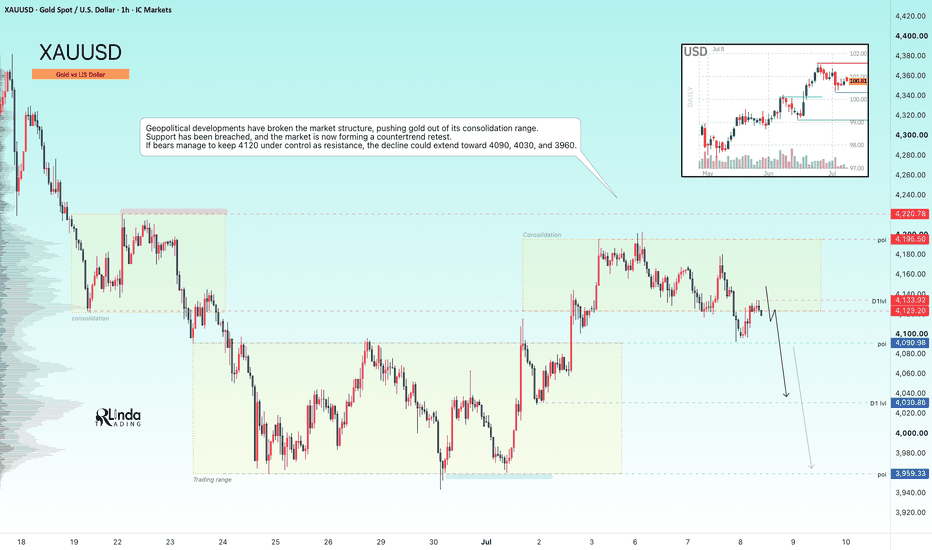
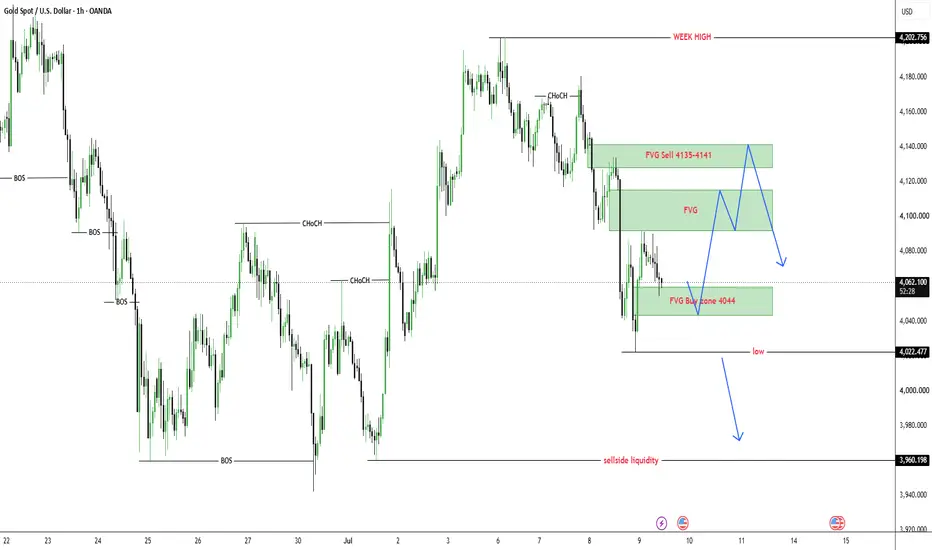
XAUUSD — Corrective Recovery After Rejecting $4,022 Low
Gold is trading around $4,062 after rejecting the lower area near $4,022. The market failed to continue the immediate downside move, so today gold may first create a corrective recovery before deciding the next larger direction.
From an SMC perspective, gold has already swept the lower liquidity near $4,022 and reacted from the FVG buy zone around $4,044–$4,060. This reaction shows that sellers may be losing short-term momentum, but the overall structure is not fully bullish yet. Price still needs to reclaim the upper FVG areas before a stronger recovery can be confirmed.
The main plan for today is to watch how gold reacts after the rejection from $4,022. If price holds above the FVG buy zone and forms bullish confirmation, gold may correct higher toward the middle FVG area first, then the FVG sell zone around $4,135–$4,141. That upper zone remains important because sellers may defend the structure there.
Buy setup 1
Condition:
Gold holds above the FVG buy zone around $4,044–$4,060 and forms bullish rejection with lower timeframe MSS / CHOCH.
Entry: $4,044–$4,060
SL: below $4,022
TP1: $4,090
TP2: $4,110–$4,115
TP3: $4,135–$4,141
Buy setup 2
Condition:
If gold breaks above the middle FVG area and retests it as support, the corrective recovery can continue toward the upper sell zone.
Entry: above $4,115 after breakout retest
SL: below $4,080
TP1: $4,135–$4,141
TP2: $4,160
TP3: $4,202 weekly high
Sell setup 1
Condition:
Gold reaches the FVG sell zone around $4,135–$4,141 and shows clear bearish rejection.
Entry: $4,135–$4,141 after rejection
SL: above $4,160
TP1: $4,090
TP2: $4,044–$4,060
TP3: $4,022
Sell setup 2
Condition:
If gold fails to hold above $4,022 and breaks the low cleanly, the correction view becomes invalid and sell-side liquidity may become the next target.
Entry: below $4,022 after breakdown retest
SL: above $4,060
TP1: $4,000
TP2: $3,980
TP3: $3,960 sell-side liquidity
Key levels
Current price area: $4,062
FVG buy zone: $4,044–$4,060
Rejected low: $4,022
Middle FVG reaction zone: $4,090–$4,115
FVG sell zone: $4,135–$4,141
Short-term resistance: $4,160
Weekly high liquidity: $4,202
Sell-side liquidity: $3,960
Bullish correction confirmation: clean break above $4,115
Stronger bullish confirmation: clean break above $4,141
Bearish continuation confirmation: clean break below $4,022
My current view is that gold may correct higher today after rejecting the decline at $4,022. The Prime Gold plan is to avoid selling low after the sweep and wait for either a buy confirmation around $4,044–$4,060 or a clearer sell reaction from $4,135–$4,141. If the $4,022 low breaks cleanly, the downside path toward $3,960 becomes active again.
No confirmation, no trade.
Long 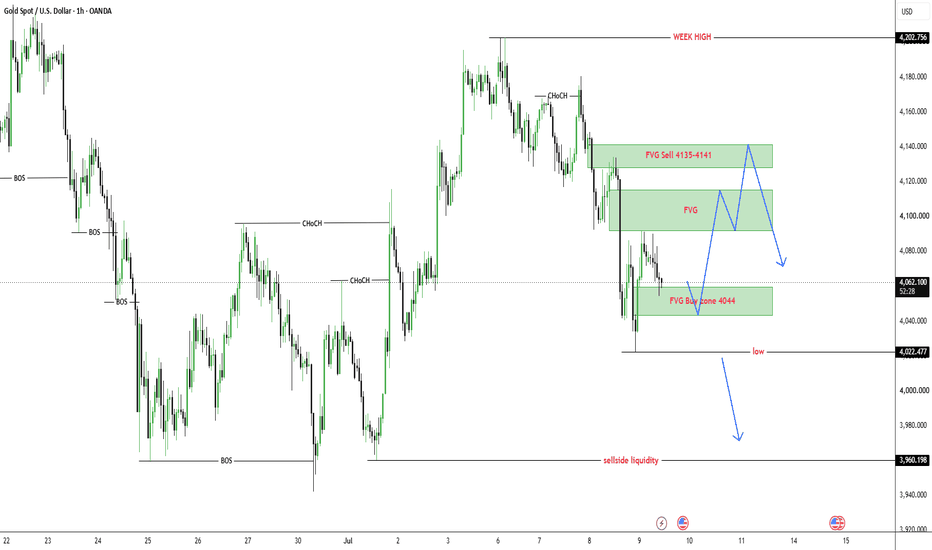
MASON XAUUSD – Intraday Bearish Bias Below Ichimoku
XAUUSD is trading around 4,057 after losing short-term bullish momentum. Price is now moving below the Ichimoku structure, while the recovery attempt is still weak and has not confirmed a bullish reversal.
The priority view for today remains sell with the short-term bearish structure, especially if gold retests the nearby sell zone and fails to break back above Ichimoku resistance.
Technical View
Gold is currently trading below the Ichimoku cloud and below the short-term resistance structure. This shows that buyers have lost control for now, and the market is still under bearish pressure in the intraday view.
The recent drop from the 4,130–4,140 area created a clear bearish impulse. After that, price only recovered weakly into the 4,060–4,075 zone, which is marked as the sell zone on the chart.
This sell zone is important because it sits near the Fibonacci reaction area and under the Ichimoku resistance. If price rejects from this area, it may confirm another lower high before continuing lower.
The 4,035–4,040 area is the first short-term liquidity reaction zone. If gold breaks below this level, selling pressure may continue toward the buy scalping liquidity area around 4,015–4,025.
The 3,984 level is also important because it is marked as a short-term price reaction zone. If bearish momentum remains strong, this area may become the next intraday target before price moves toward the deeper key support around 3,945–3,955.
Key Zones
Current price: 4,057
Sell zone: 4,060–4,075
Ichimoku resistance area: 4,130–4,147
Short-term liquidity: 4,035–4,040
Buy scalping liquidity: 4,015–4,025
Price reaction zone: 3,984
Key support zone: 3,945–3,955
Invalidation: above 4,095
Trading Plan
Sell Priority: 4,060–4,075
Condition: wait for bearish rejection, failed recovery above the sell zone, or price staying below the Ichimoku structure.
SL: above 4,095
TP1: 4,035–4,040
TP2: 4,015–4,025
TP3: 3,984
Final target: 3,945–3,955
Alternative Scenario
If gold breaks below 4,035 directly, wait for a retest of this level as resistance before looking for sell continuation toward 4,015 and 3,984.
Buy View
Buy is not the priority while price remains below the Ichimoku structure and under the sell zone. A short-term buy scalp may appear around 4,015–4,025 or 3,984, but it needs clear bullish confirmation first.
Final View
Overall, gold is still moving inside a short-term bearish structure. The cleaner plan is to wait for price to retest the 4,060–4,075 sell zone and watch for rejection. As long as gold stays below Ichimoku and below 4,095, the downside path toward 4,035, 4,015, and 3,984 remains in focus.
Will gold reject from the sell zone again, or break above Ichimoku to weaken the intraday bearish view?
Short 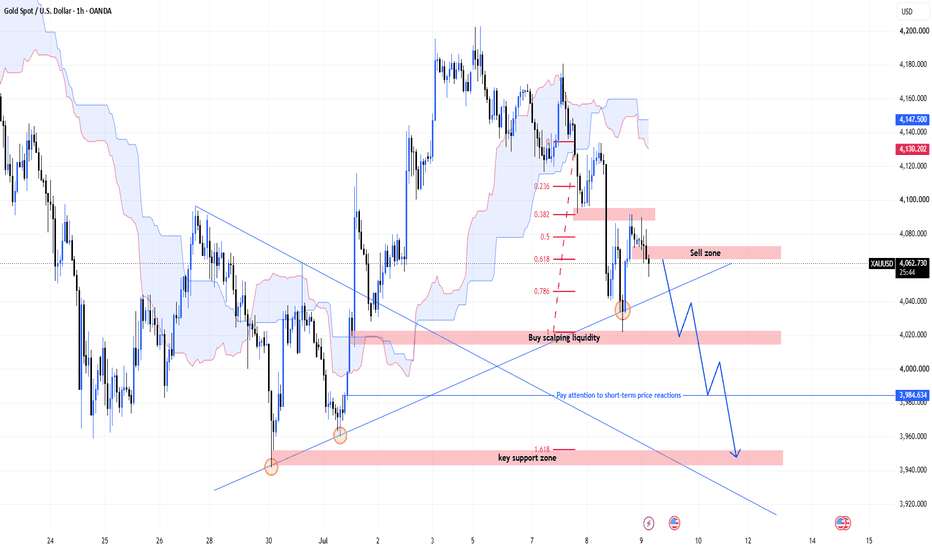
XAUUSD — Waiting Sell From EMA Value Zone
Fundamental Analysis
Gold remains sensitive to USD momentum, Treasury yields, and upcoming U.S. macro data. For now, the market is still moving with short-term bearish pressure, so any recovery should be treated as a pullback unless price can reclaim the upper resistance zone.
The better plan is to wait for price to return to a clear sell value zone instead of chasing the move after a strong drop.
Technical Analysis
On the 1H chart, XAUUSD is trading around 4,053 after reacting strongly from the 0.382 Fibonacci area near 4,041. This reaction shows that buyers are trying to defend the short-term support, but the overall structure is still not bullish yet.
Price remains inside a descending channel, and the EMA structure is still acting as dynamic resistance above the current price. The recent bounce looks more like a corrective recovery inside a bearish trend rather than a full reversal.
The main sell zone is around 4,094 - 4,101. This area aligns with the previous support turned resistance, Fibonacci reaction zone, descending trendline pressure, and EMA value area. If price recovers into this zone and rejects, sellers may continue to push gold lower.
The downside target remains around 4,003 first, followed by the psychological Fibonacci target zone near 3,990 - 3,988.
Important Key Levels
Current price area: 4,053
Fibonacci reaction support: 4,041
Main sell zone: 4,094 - 4,101
Upper resistance: 4,135
Short-term downside level: 4,003
Main Fibonacci target: 3,990 - 3,988
Invalidation area: above 4,135
Trading Scenario
Main Sell Scenario
Entry: 4,094 - 4,101
Stop Loss: 4,135
Take Profit 1: 4,041
Take Profit 2: 4,003
Take Profit 3: 3,990 - 3,988
Sell Condition
The preferred setup is to wait for gold to pull back into the 4,094 - 4,101 sell zone. This is the key value area because it combines Fibonacci structure, EMA resistance, and the descending channel reaction zone.
A sell setup becomes more valid if price forms bearish rejection from this area, such as a long upper wick, bearish engulfing candle, failed breakout, or lower high below 4,101.
If price rejects from the sell zone and breaks back below 4,041, the bearish continuation view becomes stronger. The next downside focus would be 4,003, followed by the Fibonacci psychological target around 3,990 - 3,988.
Alternative Buy Scenario
Entry: above 4,135 after breakout confirmation
Stop Loss: 4,101
Take Profit 1: 4,160
Take Profit 2: 4,180
Take Profit 3: 4,200
Buy Condition
This is not the main view. A buy setup should only be considered if gold breaks above 4,135 and holds above the descending structure with strong confirmation.
If price cannot break and hold above 4,135, the bearish setup remains the priority.
Entry Conditions
Wait for price to retest 4,094 - 4,101.
Look for bearish rejection before entering sell.
Do not sell aggressively at the low without a pullback.
A break below 4,041 confirms stronger downside pressure.
If price breaks and holds above 4,135, the sell setup is invalid.
Overall, the main view remains bearish while XAUUSD trades below the EMA resistance structure and inside the descending channel. The preferred plan is to wait for a pullback into 4,094 - 4,101, then look for sell confirmation toward 4,041, 4,003, and 3,990 - 3,988.
Do you share the same bearish view on gold, or are you waiting for a cleaner rejection from the EMA value zone first?
Short 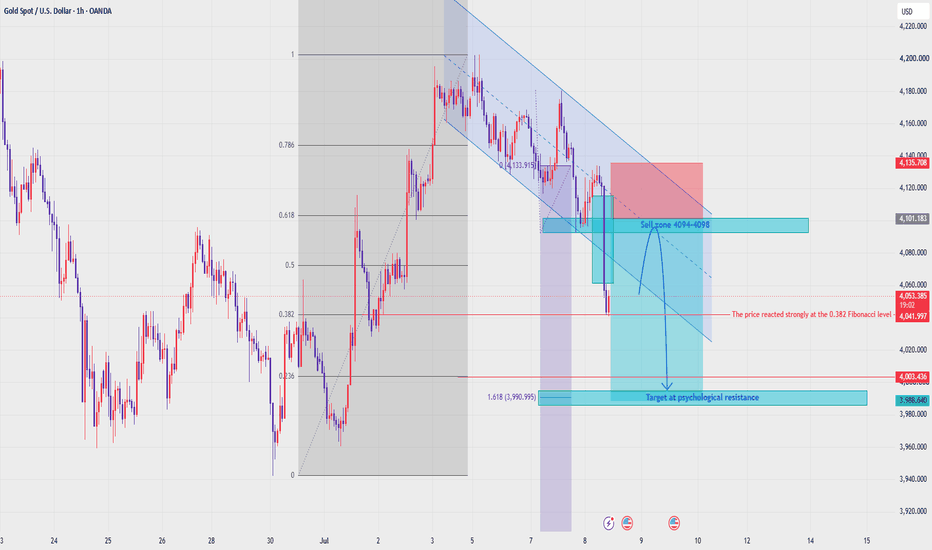
What Will Gold’s Trend Be at the Start of the Week?Market Outlook
Trend
* The short-term trend remains bullish, with price holding above the ascending trendline and maintaining a Higher High – Higher Low market structure.
* Following the breakout toward 4,185, price is currently undergoing a pullback. As long as key support levels hold, the bullish trend remains intact.
Resistance Levels
🔵 4,185 – 4,187 – Near-term resistance and the key breakout zone. A confirmed H1 candle close above this level would signal a bullish continuation.
🔵 4,227 – 4,229 – Major resistance and the next upside target if 4,185 is successfully broken.
* An H1 candle close above 4,185 would confirm that buyers have regained momentum and could drive price toward 4,228.
* If price is rejected again at this zone, a pullback toward support is likely.
Support Levels
🟢 4,094 – 4,096 – Immediate support and a key demand zone within the current uptrend.
🟢 4,029 – 4,031 – Major support, aligned with the ascending trendline.
* Holding above 4,096 indicates buyers remain in control.
* A break below 4,096 could trigger a deeper pullback toward 4,031, where buyers may step in again.
⸻
Trading Scenarios
📈 Bullish Scenario: Price holds above 4,096 and closes an H1 candle above 4,185, opening the way toward 4,228.
📉 Bearish Scenario: Price closes below 4,096, targeting 4,031. A break below 4,031 would significantly weaken the short-term bullish trend.
⸻
Trading Plan
🟢 BUY GOLD
* Entry: 4,094 – 4,096
* Stop Loss: 4,084
* Take Profit: 200 / 500 / 1000 pips
🔴 SELL GOLD
* Entry: 4,227 – 4,229
* Stop Loss: 4,239
* Take Profit: 200 / 500 / 1000 pips
Risk Management
* Risk no more than 1–2% of your account equity per trade.
* Wait for confirmation before entering any position.
* Consider moving your Stop Loss to breakeven once the trade reaches a reasonable profit level to protect your capital. Long 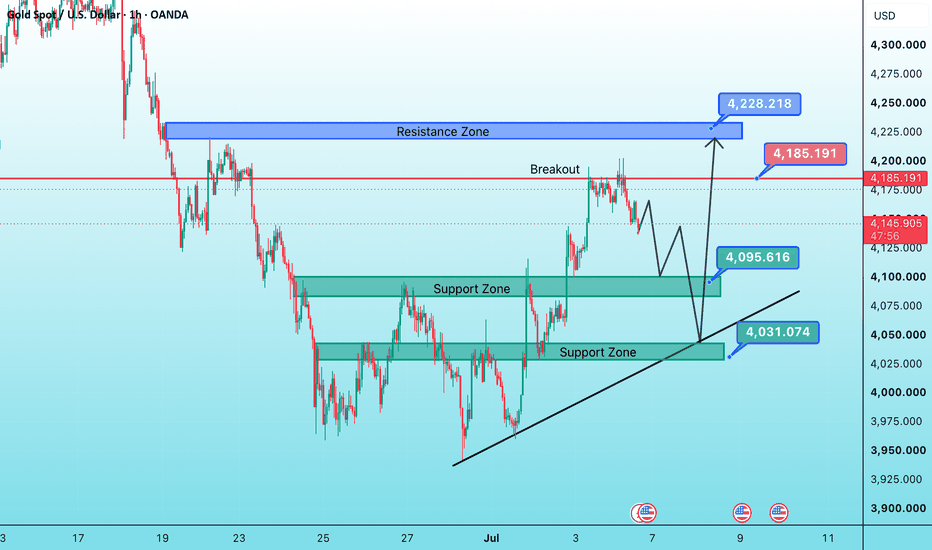
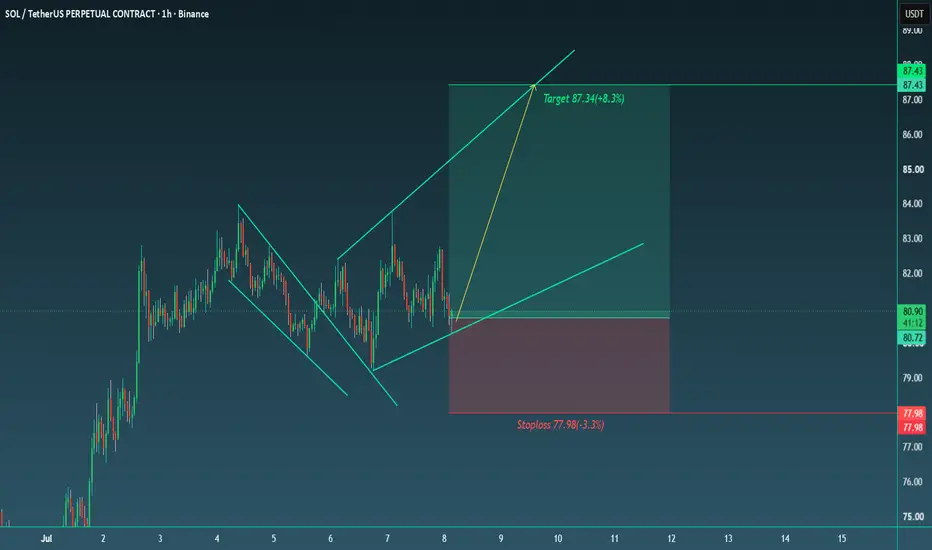
Buying SOL: Trading with BullsHello Traders!
SOL is in tricky position as it can pump hard and it can cross 95$. We are buying SOl from 80.7 but we will not aim much high.
We can see there is a pattern breakout and after the breakout market has started to form another pattern and now i am expecting that market will continue the formation and will for towards the resistive trendline.
Buy SOL from 80.7
Stoploss 77.98(-3.3%)
Target 87.34(+8.3%)
My goal is to be recognized as one of the highest win-rate traders in the TradingView community. :)
Trade Analysis Based on
> Fibonacci Tool (A1000x Way) – Custom Fibonacci approach for precise market analysis
> Candlestick Patterns – Strong price action confirmation through key candle formations
> A1000x Breakout Strategy – Identifying and trading high-probability breakout setups
> HH, HL & LH, LL Strategy – Market structure analysis for clear trend direction
> Swing Points – Tracking key highs and lows for accurate price movement insight
> A1000x Stoploss Strategy – Strategic stoploss placement for effective risk control
> A1000x Target Strategy – Structured target setting based on price action
We trade using carefully developed strategies and disciplined market analysis, always seeking the best possible accuracy while remembering that ultimate success comes only by the will of Allah.
In some trades, you may notice a relatively larger stop loss or a risk-to-reward ratio that may appear unusual at first glance. However, every trade is taken with proper planning and calculated analysis, not random entries.
Before entering any position, we perform detailed calculations and market evaluation. Based on this analysis, we carefully determine our stop loss and target levels.
I personally apply one of my specialized stop-loss and target strategies, designed to place the stop loss at a logical market level where price is less likely to reach before moving toward the intended target — InshaAllah.
Trading always involves risk, but with discipline, patience, and proper strategy, we aim for consistent and responsible decision-making.
Feel free to share your thoughts, leave a comment, or contact me.  Long
Long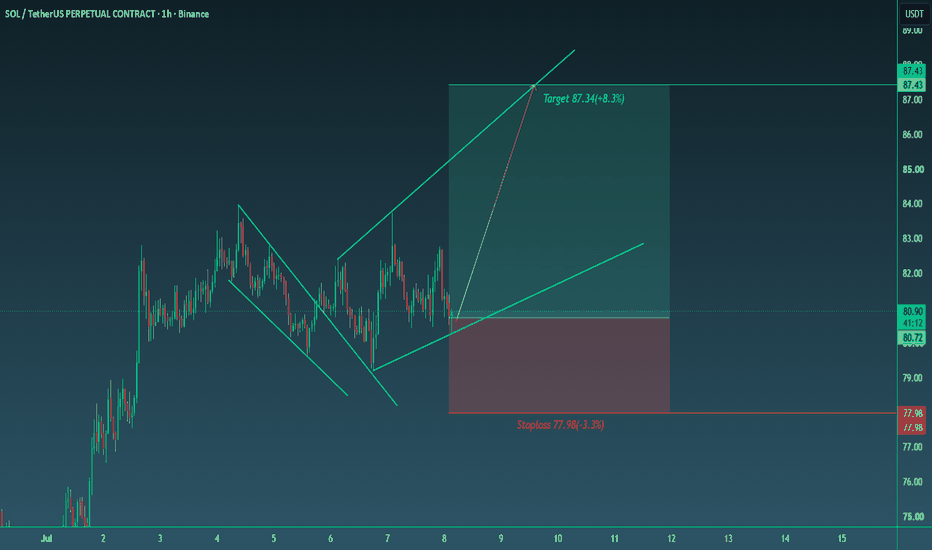
XAUUSD — Bullish Structure Holding, Buy Setup Still Priority
Gold is trading around $4,128 after forming a short-term correction from the upper reaction zone. The main structure remains bullish because price is still holding above the rising trendline and the recent market structure continues to show multiple CHOCH and BOS signals to the upside.
From an SMC perspective, gold has already shifted from the previous bearish leg into a recovery structure. The current movement looks more like accumulation and correction rather than a confirmed bearish reversal. Price is now moving inside a smaller descending correction, and this accumulation phase may continue until the US session before the next stronger move appears.
The main zone to watch is the $4,100–$4,110 buy zone test liquidity. This area is important because it sits below the current price, aligns with the correction structure, and may act as the final liquidity test before buyers attempt to push gold higher again. As long as price holds above this zone, the bullish recovery structure remains valid.
Buy setup 1
Condition:
Gold pulls back into the $4,100–$4,110 buy zone test liquidity and forms bullish rejection with lower timeframe MSS / CHOCH.
Entry: $4,100–$4,110
SL: below $4,080
TP1: $4,150
TP2: $4,175–$4,190
TP3: $4,220
TP4: $4,280
Buy setup 2
Condition:
If gold breaks above the short-term descending correction line and retests it as support, bullish continuation remains valid without waiting for a deeper pullback.
Entry: above $4,150 after breakout retest
SL: below $4,120
TP1: $4,175–$4,190
TP2: $4,220
TP3: $4,280
Sell scalping setup
Condition:
Selling is not the main priority. A sell scalp is only valid if gold reaches the $4,175–$4,190 OB sell scalping zone and shows clear bearish rejection.
Entry: $4,175–$4,190 after rejection
SL: above $4,210
TP1: $4,150
TP2: $4,128
TP3: $4,100–$4,110
Key levels
Current price area: $4,128
Main buy zone test liquidity: $4,100–$4,110
Short-term FVG reaction zone: $4,150–$4,160
OB sell scalping zone: $4,175–$4,190
Buy-side liquidity: $4,220
Main bullish target: $4,280
Bullish continuation confirmation: clean break above $4,150
Stronger bullish confirmation: clean break above $4,190
Bullish invalidation: clean 2H close below $4,080
My current view is that gold remains in a bullish structure, but the market may continue to accumulate before the US session. The Prime Gold plan is to avoid chasing price in the middle range and wait for either a pullback into $4,100–$4,110 or a clean breakout above the correction line before looking for buy confirmation. As long as the buy zone holds, the priority remains buying toward $4,175, $4,220 and potentially $4,280.
No confirmation, no trade.
Long 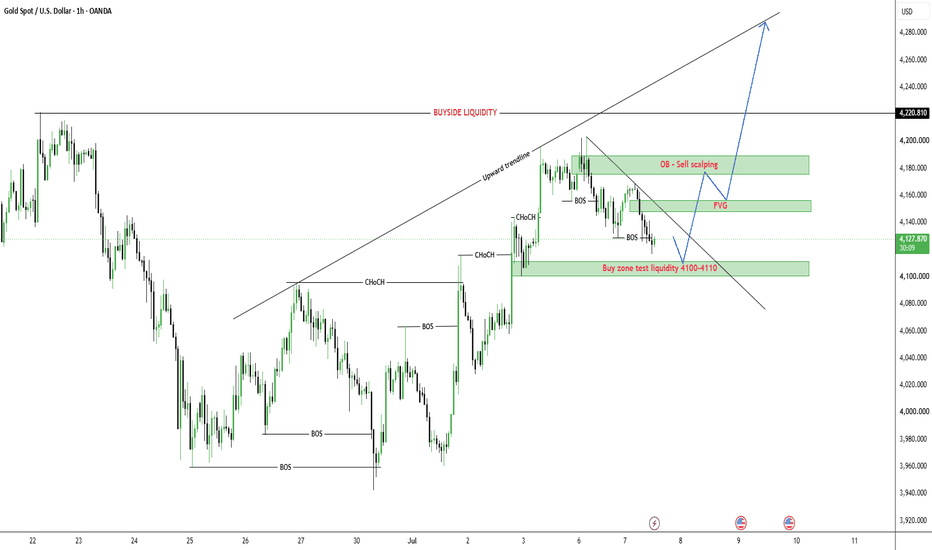
XAUUSD 30M Analysis SMC + ICT Liquidity Based Market Structure Gold (XAUUSD) is currently showing a short-term bearish correction after rejecting from a premium liquidity zone near the weekly high area. Price formed a liquidity sweep above previous highs (EQH) and faced strong selling pressure from the institutional order block, indicating that sellers are actively defending the premium zone.
From a Smart Money Concepts (SMC) perspective, the market has shown multiple CHoCH (Change of Character) and BOS (Break of Structure) signals, confirming a shift in short-term momentum. The current price action suggests that liquidity is being targeted below the market before any potential bullish continuation.
Technical Analysis:
Price rejected from the premium supply zone / order block around 4,160–4,170.
A bearish structure shift occurred after CHoCH confirmation, showing seller dominance.
Current price is approaching a key demand order block zone around 4,100–4,110, where buyers may look for liquidity absorption.
If price respects this demand zone and forms bullish confirmation, a recovery move toward:
Resistance: 4,139
Key level: 4,151
Order Block zone: 4,160–4,170 can be expected.
A strong break below the 4,100 support area may open the way toward deeper liquidity zones.
ICT / Liquidity Analysis:
The current setup follows an institutional liquidity model:
Buy-side liquidity was collected near the weekly high.
Price moved away from the premium zone after filling institutional selling orders.
The market is now seeking sell-side liquidity below recent lows.
The reaction from the demand order block will decide the next major direction.
Fundamental Analysis:
Gold remains highly sensitive to global macroeconomic factors. The main drivers currently include:
US Dollar strength: A stronger USD can pressure Gold prices lower, while dollar weakness supports bullish moves.
Federal Reserve interest rate expectations: Any change in rate-cut expectations can create volatility in XAUUSD.
Inflation data and economic reports: CPI, employment data, and central bank comments remain key catalysts.
Geopolitical uncertainty: Safe-haven demand can support Gold during periods of market risk.
Fundamentally, Gold maintains long-term support due to central bank demand and safe-haven interest, but short-term movements depend heavily on USD performance and upcoming economic data.
Trading Scenario:
Bullish Scenario: If Gold holds the 4,100–4,110 order block and confirms a reversal with CHoCH, buyers may target 4,139 → 4,151 → 4,170.
Bearish Scenario: If price fails to hold demand and breaks below 4,100, further downside liquidity collection is possible.
Conclusion:
XAUUSD is currently trading inside a corrective phase after a premium liquidity rejection. The key area to watch is the 4,100–4,110 institutional demand zone. Confirmation through market structure, liquidity reaction, and volume will determine the next high-probability move.
Educational purpose only — Always apply proper risk management and wait for confirmation before entering any trade. Long 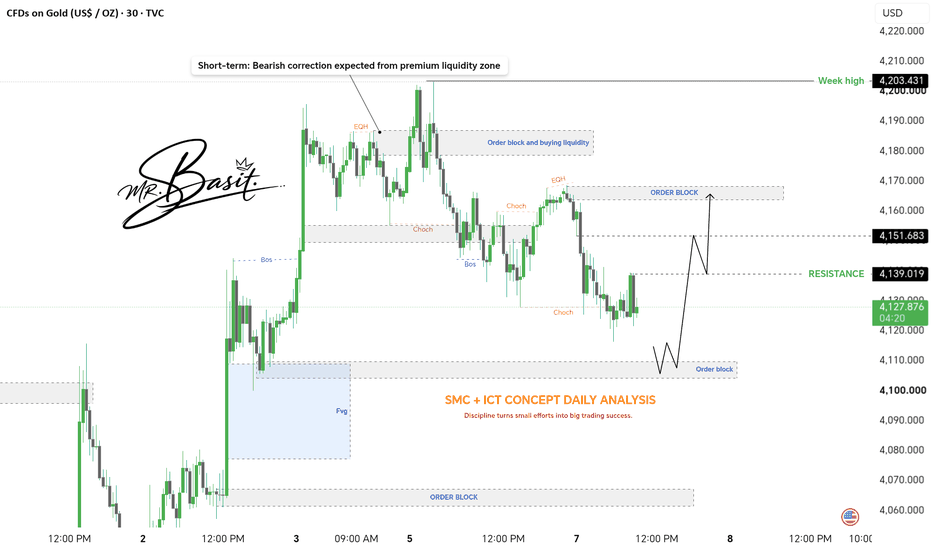
HYPEUSDT - Consolidation Before Further Growth BINANCE:HYPEUSDT.P is consolidating within both its local and global bullish trends. Technically, this phase appears to be a period of accumulation before a potential continuation of the uptrend
Bitcoin is currently caught between three major forces: the Fed's softer rhetoric, a reversal in ETF flows, and renewed geopolitical tensions in the Middle East. While Bitcoin remains in a countertrend correction within its broader bearish trend, HYPE continues to show relative strength. The market is forming two key trigger levels around the boundaries of the current trading range: 72.09 and 68.30
Resistance levels: 72.09, 77.00
Support levels: 68.30, 65.60
Technically, two scenarios remain in focus before the next bullish leg. The first is a retest of resistance followed by a breakout, where consolidation and a close above 72.09 could trigger further upside. Alternatively, the market may first perform a long squeeze below the 68.30 support level before resuming its upward trend
Best regards,
R. Linda  Long
Long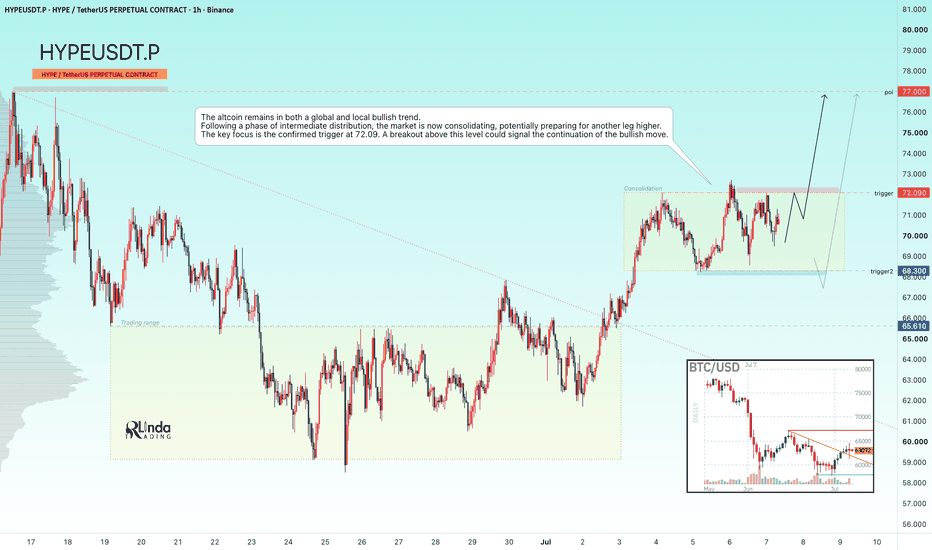
XAUUSD — Pullback to Fibonacci Before Bullish Recovery
Fundamental Analysis
Gold remains sensitive to USD momentum, Treasury yields, and upcoming U.S. macro data. For now, the market is still moving inside a technical recovery phase, but traders should avoid chasing price near the middle of the range.
The better plan is to wait for price to return to a clear value zone before looking for continuation.
Technical Analysis
On the 2H chart, XAUUSD is trading around 4,129 after losing short-term momentum near the current EMA area. Price is still holding above the lower recovery structure, but the market may need one more pullback before buyers step in again.
The key area to watch is the Fibonacci and liquidity buy zone around 4,056 - 4,073. This zone aligns with the previous reaction area, Fibonacci support, and short-term liquidity.
If gold drops into this zone and forms bullish rejection, the recovery scenario may continue toward the resistance and Fibonacci zone around 4,212 - 4,231.
However, if price fails to hold the buy zone, the downside may extend toward 4,001.
Important Key Levels
Current price area: 4,129
Short-term EMA reaction area: 4,110 - 4,135
Main buy zone: 4,056 - 4,073
Deeper downside liquidity: 4,001
Near resistance: 4,151 - 4,160
Main upside target: 4,212 - 4,231
Invalidation area: below 4,001
Trading Scenario
Main Buy Scenario
Entry: 4,056 - 4,073
Stop Loss: 4,001
Take Profit 1: 4,110
Take Profit 2: 4,151
Take Profit 3: 4,212 - 4,231
Buy Condition
The preferred setup is to wait for gold to pull back into the 4,056 - 4,073 Fibonacci and liquidity buy zone. This area is important because it gives a cleaner value entry instead of buying in the middle of the current range.
A buy setup becomes more valid if price forms bullish rejection from this zone, such as a long lower wick, bullish engulfing candle, higher low formation, or a clean reclaim above 4,073.
If gold reacts from the buy zone and breaks back above 4,151, the bullish recovery view becomes stronger. The next upside focus would be 4,212 - 4,231.
Alternative Sell Scenario
Entry: below 4,001 after breakdown confirmation
Stop Loss: 4,056
Take Profit 1: 3,960
Take Profit 2: 3,930
Take Profit 3: 3,900
Sell Condition
This is not the main view. A sell setup should only be considered if gold breaks below 4,001 and fails to recover the Fibonacci buy zone.
If price loses 4,001 with strong bearish momentum, the recovery structure becomes weaker and gold may continue toward lower liquidity areas.
Entry Conditions
Wait for price to test 4,056 - 4,073.
Look for bullish rejection before entering buy.
Do not chase price while it is still between support and resistance.
A break above 4,151 confirms stronger recovery momentum.
If price breaks and holds below 4,001, the buy setup is invalid.
Overall, the main view is that gold may drop first into the Fibonacci and liquidity zone before creating a stronger bullish recovery. The preferred plan is to wait for confirmation around 4,056 - 4,073, then look for continuation toward 4,151 and 4,212 - 4,231.
Do you share the same view that gold needs one more pullback before the next bullish recovery?
Short 
XAUUSD: Wave C Pullback May Prepare the Next Buy Setup
Gold is currently moving inside a corrective ABC structure after the previous strong bullish recovery. From Kelly’s view, price is now developing wave C lower, and the next important setup may appear only when this corrective wave finishes around the support zone.
The key idea is simple: gold is correcting now, but if wave C ends cleanly near support, buyers may step back in for the next recovery phase.
⟡ Market structure
The chart shows gold rejected from the upper resistance area after completing a strong upside move. Price then started to form an ABC correction, with wave A pulling lower, wave B reacting near resistance, and wave C now moving down towards the buy zone.
The current price is trading below the sell liquidity area around 4,135–4,141, which means short-term pressure still remains. However, the larger recovery structure has not fully failed yet because the main reaction zone below is still waiting near 4,060–4,075.
This area is important because it is marked as the zone where the ABC wave may end.
➤ Key levels
◌ 4,135–4,141: sell liquidity and short-term resistance
◌ 4,127: current reaction area
◌ 4,100: support response level to watch
◌ 4,060–4,075: buy zone and possible ABC wave C completion
◌ 4,168: key resistance confirming stronger recovery
◌ Below 4,060: area where the bullish recovery setup weakens
⌁ Elliott Wave view
From an Elliott Wave perspective, gold appears to be correcting after completing the previous bullish 5-wave movement.
Wave A created the first pullback from the high.
Wave B reacted higher but failed to break the key resistance.
Wave C is now developing lower towards the buy zone.
If wave C finishes around 4,060–4,075 and price prints a bullish confirmation candle, the ABC correction may be complete. From there, gold could begin a new recovery attempt back towards 4,135–4,141 first, then 4,168 if momentum improves.
▸ Trading scenario
Preferred scenario: wait for wave C to complete around the buy zone before looking for buy confirmation.
Entry zone: 4,060–4,075 if bullish confirmation appears
Stop loss: below the confirmed wave C low
Take profit 1: 4,100
Take profit 2: 4,135–4,141
Take profit 3: 4,168
Alternative scenario: if gold breaks below 4,060 with strong bearish pressure, the ABC buy setup weakens and price may need to search for a deeper support base before recovery can continue.
⌁ Kelly’s view
For Kelly, this is not a buy-now structure yet. Gold is still moving inside wave C, so patience is important.
The cleaner setup is to wait for price to complete the correction near the buy zone, then watch whether buyers defend that support with a clear reaction.
Gold is correcting inside wave C.
If the buy zone holds, the next recovery phase may start from there.
Share your view below.
Short 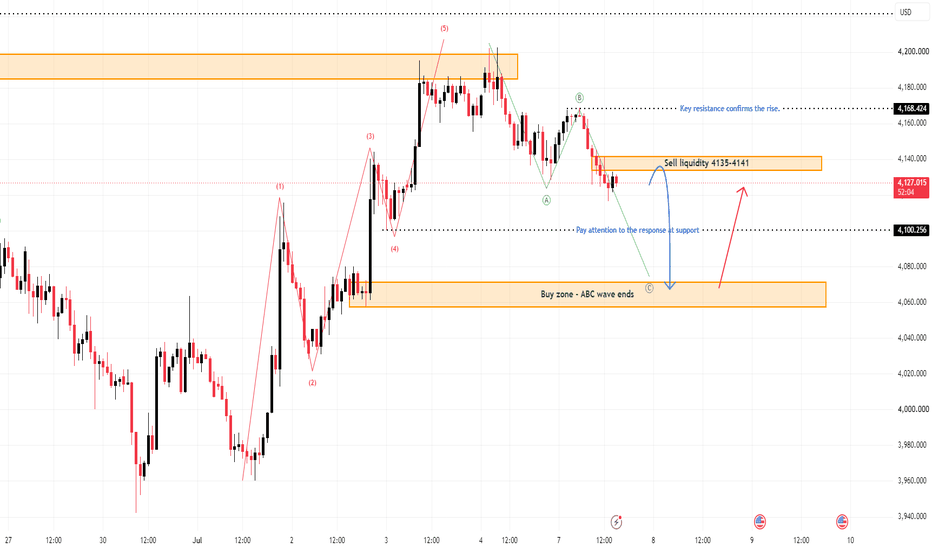
XAUUSD – Gold Corrects Into Fibonacci And Ichimoku Support
XAUUSD is trading around 4,129 after pulling back from the recent high area near 4,190–4,200. The short-term bullish structure is still valid, but price is now correcting into an important Fibonacci and Ichimoku support area.
The priority view remains buy on pullback, as long as gold holds above the key Fibonacci zones and does not break below the rising structure.
Technical View
Gold has created a strong recovery from the previous strong support zone around 3,960. The market moved higher and formed a clear bullish leg, showing that buyers were in control during the recent move.
However, price is now correcting after reaching the upper resistance and descending trendline area near 4,190–4,200. This pullback is normal after a strong bullish move, but the key question is whether buyers can defend the Fibonacci support zones.
The current area around 4,128–4,136 is acting as a short-term reaction zone. Price is testing this area after the pullback, but a clean bullish continuation still needs stronger confirmation.
The first important buy zone is 4,102–4,106. This zone aligns with the Fibonacci 0.618 area and also sits close to the Ichimoku support structure. If gold pulls back here and forms bullish rejection, it may confirm a higher low before the next upside move.
The deeper buy zone is 4,071–4,075, near the Fibonacci 0.5 area. If the first buy zone fails, this lower zone becomes the next area to watch for a stronger reaction.
Ichimoku still supports the recovery structure as long as price holds above the main cloud support and does not close deeply below the lower support zone. A clean break below 4,071 would weaken the bullish view and may open a deeper correction.
The upside target remains around 4,190–4,200, where the descending trendline and recent resistance are located. If gold breaks above this zone, the bullish structure may extend further.
Key Zones
Current price: 4,129
Short-term reaction zone: 4,128–4,136
Buy order zone 1: 4,102–4,106
Buy order zone 2: 4,071–4,075
Ichimoku support area: 4,115–4,166
Upper resistance: 4,190–4,200
Major trendline resistance: around 4,200
Invalidation: below 4,071
Trading Plan
Buy Priority: 4,102–4,106
Condition: wait for bullish rejection, higher low formation, or price holding above the Fibonacci 0.618 zone and Ichimoku support.
SL: below 4,071
TP1: 4,136
TP2: 4,166
TP3: 4,190–4,200
Alternative Scenario
If gold breaks below 4,102–4,106, wait for the deeper buy zone at 4,071–4,075. A bullish reaction from this area may still support continuation, but confirmation must be clearer.
Sell View
Sell is not the priority while price remains above the Fibonacci support zones and the rising structure. A sell setup only becomes safer if gold breaks below 4,071 and fails to recover back above the Ichimoku support area.
Final View
Overall, gold is correcting after a strong bullish move, but the main structure is not broken yet. The cleaner plan is to wait for price to test the Fibonacci and Ichimoku support zones around 4,102–4,106 or 4,071–4,075. If buyers defend these areas, gold may continue toward 4,166 and 4,190–4,200.
Will gold hold the Fibonacci support zone and continue higher, or break lower into a deeper correction first?
Long 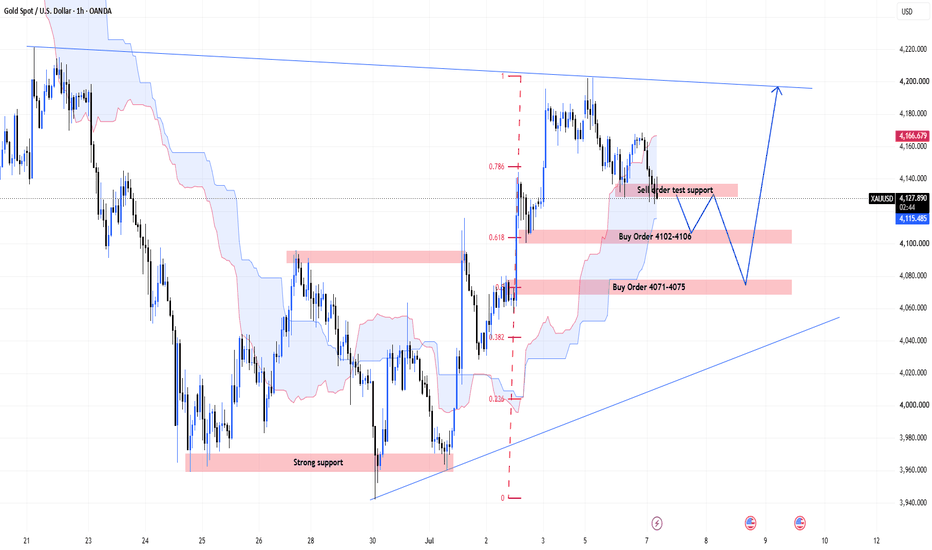
GOLD - A pullback before a potential rise to 4220 Following the breakout above the 4100 consolidation range and the recent rally, ICMARKETS:XAUUSD has entered a corrective phase. The geopolitical and fundamental backdrop remains unstable
Gold staged a strong recovery after weaker-than-expected U.S. employment data shifted Fed expectations from hawkish to more neutral. The probability of a September rate hike has fallen from 66% to around 53–55%, while the U.S. dollar has stalled and Treasury yields have declined, creating favorable conditions for a rebound after gold's sharpest quarterly drop in years.
However, with the start of the new trading week, gold has temporarily lost momentum due to renewed geopolitical developments. Market attention is now focused on headlines from the Middle East and the return of liquidity following the U.S. holiday weekend.
Key drivers:
Bearish for gold: stronger U.S. dollar, renewed geopolitical risks, profit-taking after the recent rally.
Bullish for gold: weaker U.S. dollar, progress in geopolitical negotiations, and the return of market liquidity after the U.S. holidays
Resistance levels: 4198, 4220
Support levels: 4144, 4121, 4095
Technically, market makers may target a retest of the 4198–4220 liquidity zone and the recent swing high. However, both the Asian and European sessions are currently favoring a corrective move and a liquidity hunt before another potential rally. A long squeeze into the 4144–4121 support zone could trigger another bullish impulse.
However, keep in mind that both the local and the broader market trends remain bearish.
Best regards,
R. Linda Long 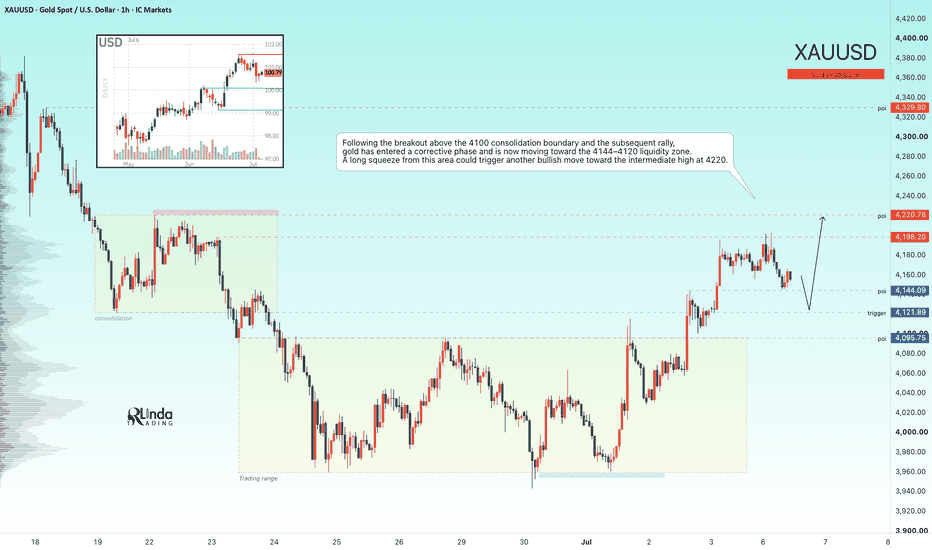
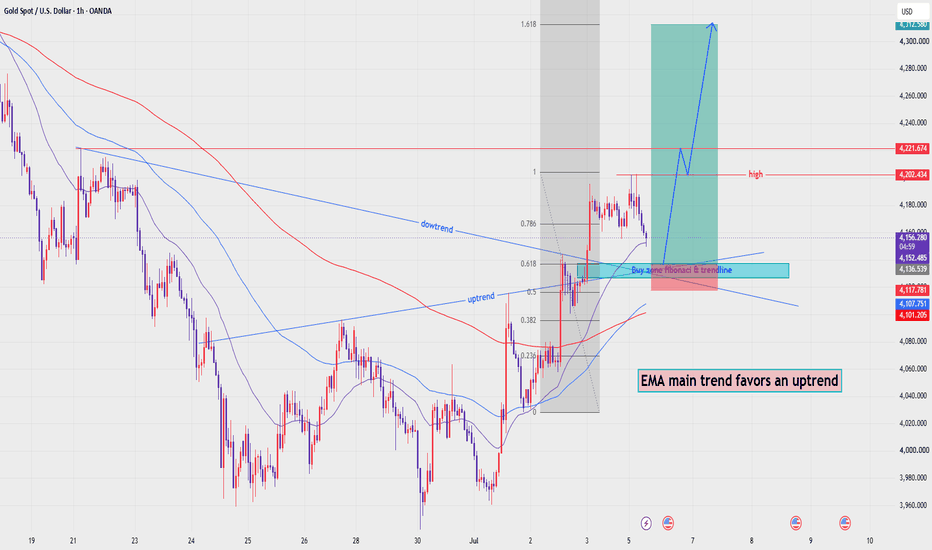
XAUUSD — EMA Uptrend Holds, Buy From Value Zone
Fundamental Analysis
Gold is holding a stronger recovery structure as traders continue to watch USD momentum, Treasury yields, and upcoming U.S. macro data.
For now, the technical structure remains constructive while price holds above the rising EMA support zone.
Technical Analysis
On the 1H chart, XAUUSD is trading around 4,155 after a strong bullish recovery from the lower structure. EMA 34, EMA 89, and EMA 200 are starting to turn upward, showing that buyers are gaining control of the short-term trend.
Price is currently testing the EMA 34 area, which is also close to the Fibonacci and trendline value zone. This is an important area because a bullish reaction here may confirm that the market is preparing for another continuation move.
The key buy zone is around 4,136 - 4,152. This zone aligns with EMA 34, Fibonacci support, and the rising trendline structure.
If buyers defend this area, gold may continue toward the previous high around 4,202, then 4,221. A stronger breakout may open the way toward the Fibonacci extension target around 4,312.
Important Key Levels
Current price area: 4,155
Main buy zone: 4,136 - 4,152
EMA 34 reaction area: around 4,152
EMA support area: 4,107 - 4,136
Short-term resistance: 4,202
Breakout resistance: 4,221
Main upside target: 4,281 - 4,312
Invalidation area: below 4,101
Trading Scenario
Main Buy Scenario
Entry: 4,136 - 4,152
Stop Loss: 4,101
Take Profit 1: 4,202
Take Profit 2: 4,221
Take Profit 3: 4,281 - 4,312
Buy Condition
The preferred setup is to wait for gold to hold the 4,136 - 4,152 buy zone. This area is important because price is testing EMA 34 while still holding above the rising EMA structure.
A buy setup becomes more valid if price forms bullish rejection from this zone, such as a long lower wick, bullish engulfing candle, higher low formation, or a clean reclaim above 4,160.
If price holds above the buy zone and breaks 4,202, the bullish continuation view becomes stronger. The next upside targets would be 4,221, then 4,281 - 4,312.
Alternative Sell Scenario
Entry: below 4,101 after breakdown confirmation
Stop Loss: 4,136
Take Profit 1: 4,079
Take Profit 2: 4,040
Take Profit 3: 4,020
Sell Condition
This is not the main view. A sell setup should only be considered if gold breaks below 4,101 and fails to reclaim the EMA support structure.
If price loses the rising trendline and closes below the EMA value zone, the bullish setup becomes weaker and gold may retest lower liquidity areas.
Entry Conditions
Wait for price to react around 4,136 - 4,152.
Look for bullish confirmation before entering buy.
Do not chase price if it moves directly into resistance.
A break above 4,202 confirms stronger bullish momentum.
If price breaks and holds below 4,101, the buy setup is invalid.
Overall, the main view remains bullish while XAUUSD holds above the rising EMA structure. Price is now testing EMA 34, so the preferred plan is to wait for a clean reaction from 4,136 - 4,152 before looking for continuation toward 4,202, 4,221, and 4,281 - 4,312.
Do you share the same bullish view on gold, or are you waiting for a stronger confirmation above 4,202?
Long