First-hour high/low: real market vs random direction
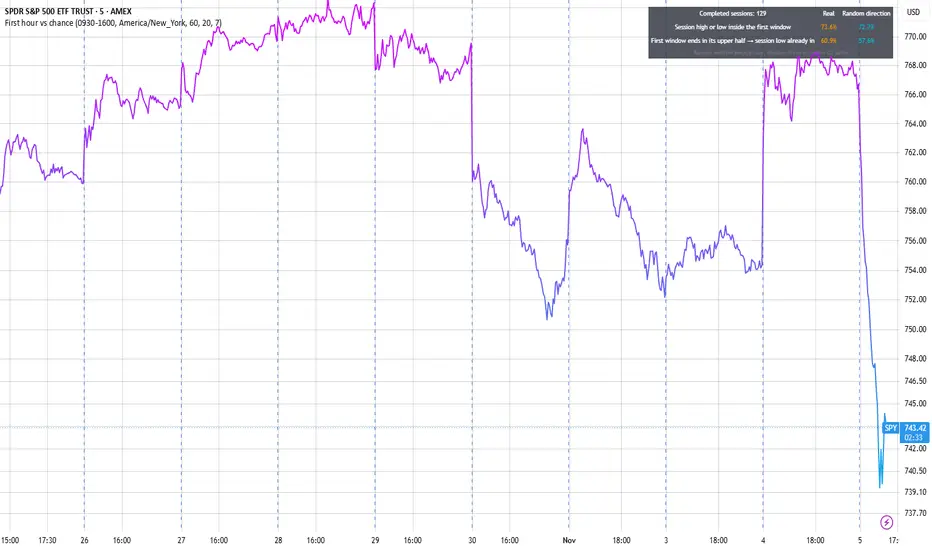
A popular statistic says that on 7 days out of 10 the session's high or low is set in the first hour. Another says that if the first hour ends in the upper part of its range, the session low is usually already in. This script checks both on your chart, and checks them again on random paths built from the same bars.
What it counts, over the loaded history:
1. Session high or low inside the first window: the share of completed sessions whose high or low was set in the first N minutes.
2. First window ends in its upper half → session low already in: among sessions whose first window closed above the middle of its range, the share whose session low had already been set in that window.
The random benchmark. For every bar, each random path keeps the bar's exact moves from the previous close (open, high, low and close) but flips their direction with a coin toss. Each path therefore has the same bar-by-bar volatility as the real market, including the busy open, but no direction at all. The table shows the same two rates averaged over all paths.
What to expect. Both statistics replicate, and random paths give almost the same numbers. On SPY 5-minute at publication (129 sessions): 73.6% real vs 72.7% random for the first rate, and 60.9% vs 57.6% for the second. The extremes cluster in the first hour because volatility is highest there and because, even at random, extremes tend to sit near the start or the end of a period. Knowing where the extreme will probably be says nothing about the direction of the rest of the day.
Settings. Session and time zone (default 09:30-16:00 New York), length of the first window in minutes, number of random paths and the random seed. Use an intraday chart; 1 to 5 minutes is best. Sessions still in progress are not counted.
Limitations. Descriptive statistics, before costs. The random paths reuse the chart's own bars, so the benchmark depends on the history loaded. With few sessions, differences of a few points are noise.
Educational tool. Not investment advice.
---
ES
Máximo o mínimo en la primera hora: mercado real frente a dirección aleatoria. El script cuenta, en las sesiones completas del gráfico, cuántas veces el máximo o el mínimo de la sesión cae en la primera ventana, y cuántas veces «el mínimo ya está puesto» si la primera hora cierra en la mitad alta de su rango. Después repite la cuenta en caminos aleatorios que conservan el tamaño exacto de cada barra pero sortean su dirección. En SPY de 5 minutos al publicar (129 sesiones): 73,6 % real frente a 72,7 % al azar, y 60,9 % frente a 57,6 %. La estadística es cierta, pero el azar con la misma volatilidad da casi lo mismo. Herramienta educativa; no es asesoría de inversión.
What it counts, over the loaded history:
1. Session high or low inside the first window: the share of completed sessions whose high or low was set in the first N minutes.
2. First window ends in its upper half → session low already in: among sessions whose first window closed above the middle of its range, the share whose session low had already been set in that window.
The random benchmark. For every bar, each random path keeps the bar's exact moves from the previous close (open, high, low and close) but flips their direction with a coin toss. Each path therefore has the same bar-by-bar volatility as the real market, including the busy open, but no direction at all. The table shows the same two rates averaged over all paths.
What to expect. Both statistics replicate, and random paths give almost the same numbers. On SPY 5-minute at publication (129 sessions): 73.6% real vs 72.7% random for the first rate, and 60.9% vs 57.6% for the second. The extremes cluster in the first hour because volatility is highest there and because, even at random, extremes tend to sit near the start or the end of a period. Knowing where the extreme will probably be says nothing about the direction of the rest of the day.
Settings. Session and time zone (default 09:30-16:00 New York), length of the first window in minutes, number of random paths and the random seed. Use an intraday chart; 1 to 5 minutes is best. Sessions still in progress are not counted.
Limitations. Descriptive statistics, before costs. The random paths reuse the chart's own bars, so the benchmark depends on the history loaded. With few sessions, differences of a few points are noise.
Educational tool. Not investment advice.
---
ES
Máximo o mínimo en la primera hora: mercado real frente a dirección aleatoria. El script cuenta, en las sesiones completas del gráfico, cuántas veces el máximo o el mínimo de la sesión cae en la primera ventana, y cuántas veces «el mínimo ya está puesto» si la primera hora cierra en la mitad alta de su rango. Después repite la cuenta en caminos aleatorios que conservan el tamaño exacto de cada barra pero sortean su dirección. En SPY de 5 minutos al publicar (129 sesiones): 73,6 % real frente a 72,7 % al azar, y 60,9 % frente a 57,6 %. La estadística es cierta, pero el azar con la misma volatilidad da casi lo mismo. Herramienta educativa; no es asesoría de inversión.

Feragatname
Bilgiler ve yayınlar, TradingView tarafından sağlanan veya onaylanan finansal, yatırım, alım satım veya diğer türden tavsiye veya öneriler anlamına gelmez ve teşkil etmez. Kullanım Koşulları bölümünde daha fazlasını okuyun.
Feragatname
Bilgiler ve yayınlar, TradingView tarafından sağlanan veya onaylanan finansal, yatırım, alım satım veya diğer türden tavsiye veya öneriler anlamına gelmez ve teşkil etmez. Kullanım Koşulları bölümünde daha fazlasını okuyun.