OPEN-SOURCE SCRIPT
Güncellendi MFB - Levels Coherence - Gold OR
Peace –
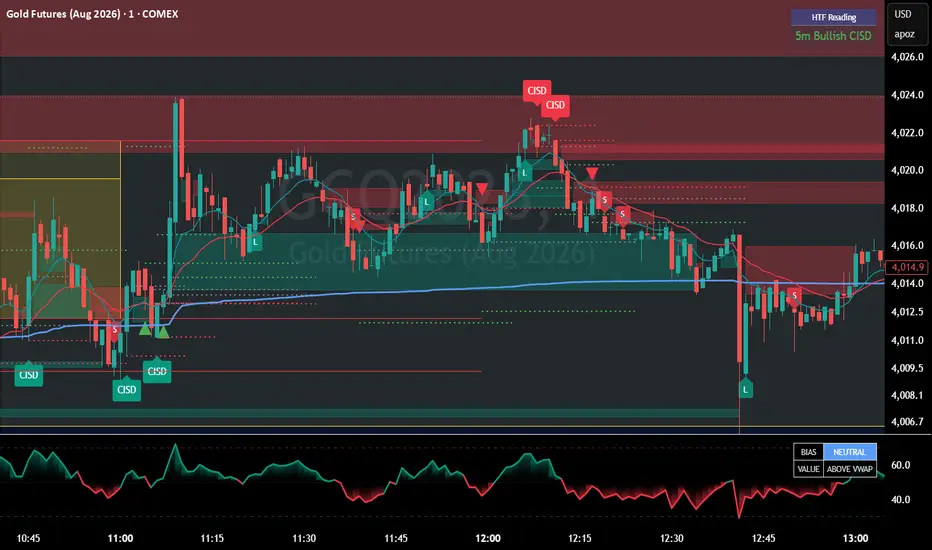
This new version of "MFB - Levels Confluence" called “MFB - Levels Confluence Gold OR” includes the Gold Futures (Comex) opening range levels in settings.
The 30 minute opening range (8:20am to 8:50am EST) is different than the NY opening range times, so I thought to add the valid Opening Range highs and lows in case anyone is trading Gold Futures.
Also included, is the option to select which trading sessions will print Opening Range highs and lows, as well as “CISD” label related to Comex OR levels.
I am learning to trade the Gold Futures, so I thought to work with "Luxalgo - Quant" to create an indicator that is already set to identify the Comex market opening ranges for the 30 min "ORB" 8:20am to 8:50am EST high and lows, and the 8:20am to 9:20am EST highs and lows.
The Gold “ORB” strategies that I have been learning from, mention levels where price is expressing “Acceptance” and “Rejection” (as usual).
Sometimes, price may retrace to the 50% of the Opening Range, before re-engaging the original price move that took the high or low liquidity (and then following through displacing the level).
That said, I learned that the 50% of the Opening range high and low is a good soft target (or place to the move stop loss near), yet, Price may still continue to the opposing OR level though.
I was reading that at around 9:20am EST, the market often starts to reveal whether price is going to be “Accepted” (or not) beyond the opening range highs and lows. This is interesting to me, because, trading Gold futures is an entire other trading session before the NY session opening ranges even form.
I like working with “Universal MFB – Flow/Sweep/FVG-123 Setup” indicator for FVG-123 signals (1 min charts) – while watching the 5 min candle closures for structural support before entering an “Acceptance” (or not) trade entry beyond (or reversal) a key level.
Gold often moves fast, and does not print FVG-123 signals on the 1 min chart – That is why the 5 min CISD was included in this “MFB - Levels Confluence Gold OR” indicator version.
The other indicator I am considering for a 1 min chart VWAP, 9/20 EMA retrace trade entry is the “MFB – Value Acceptance” indicator.
Anyway. Learning along. Interesting.
Here is a “Luxalgo – Quant” description –
- The indicator (as the other indicators) works with the usual "Momentum Flow Build w/FVG v6 (Clean)" key levels. Giving thanks. Peace.
MFB - Levels Coherence - Gold OR
The MFB - Levels Coherence - Gold OR indicator retains the exact same powerful, logic-driven foundation as the original "Levels Coherence" indicator.
It acts as an active Session Guide designed to discern the most probable market direction by analyzing the immediate relationship between intraday Opening Ranges (Internal Liquidity) and significant historical boundaries (External Liquidity).
Just like the original, it uses the Confluence Distance (12 points) to classify setups:
• Confluence AOI (Sweep/Reversals): Price sweeps a clustered Opening Range and External Liquidity zone, rejects it, and forms a confirming FVG-123.
• Pathway Mode (Acceptance/Continuations): Price breaks clean outside an Opening Range that has no nearby External Liquidity, signaling true momentum.
What Makes the "Gold OR" Version Unique?
We tailored this version specifically for the unique rhythm of Gold Futures trading. Here are the key upgrades and custom default settings that were added:
1. Comex (Gold) Session Default:
• Instead of defaulting to the standard Equities/NY Open (09:30 AM ET), this version automatically targets the Comex Open with a dedicated 08:20–08:50 AM ET session block.
2. Tailored Opening Range Views:
• Gold traders often rely heavily on slightly higher timeframe boundaries. By default, the 15-minute Opening Range lines are turned off, keeping your chart clean. The indicator defaults to showing only the critical 30-minute and 1-hour Opening Range highs and lows.
• New Feature: You now have individual toggles and thickness controls for the 15m, 30m, and 1h lines, allowing you to perfectly customize the visual layout to your specific trading window.
3. The 5-Minute CISD Label:
• New Feature: We introduced a specific 5m CISD (Change in State of Delivery) mechanical label. If you are trading on the 5-minute chart, the indicator actively watches those 30m and 1h Opening Range boundaries. If price pierces one of those boundaries, closes back inside, and triggers a valid CISD crossover, a diamond "CISD" label will print on the chart—giving you an extra layer of structural confirmation right at the liquidity zone.
This version gives Gold traders the exact same disciplined liquidity filtering as the original, but perfectly tuned and out-of-the-box ready for the Comex open!
Peace -
This new version of "MFB - Levels Confluence" called “MFB - Levels Confluence Gold OR” includes the Gold Futures (Comex) opening range levels in settings.
The 30 minute opening range (8:20am to 8:50am EST) is different than the NY opening range times, so I thought to add the valid Opening Range highs and lows in case anyone is trading Gold Futures.
Also included, is the option to select which trading sessions will print Opening Range highs and lows, as well as “CISD” label related to Comex OR levels.
I am learning to trade the Gold Futures, so I thought to work with "Luxalgo - Quant" to create an indicator that is already set to identify the Comex market opening ranges for the 30 min "ORB" 8:20am to 8:50am EST high and lows, and the 8:20am to 9:20am EST highs and lows.
The Gold “ORB” strategies that I have been learning from, mention levels where price is expressing “Acceptance” and “Rejection” (as usual).
Sometimes, price may retrace to the 50% of the Opening Range, before re-engaging the original price move that took the high or low liquidity (and then following through displacing the level).
That said, I learned that the 50% of the Opening range high and low is a good soft target (or place to the move stop loss near), yet, Price may still continue to the opposing OR level though.
I was reading that at around 9:20am EST, the market often starts to reveal whether price is going to be “Accepted” (or not) beyond the opening range highs and lows. This is interesting to me, because, trading Gold futures is an entire other trading session before the NY session opening ranges even form.
I like working with “Universal MFB – Flow/Sweep/FVG-123 Setup” indicator for FVG-123 signals (1 min charts) – while watching the 5 min candle closures for structural support before entering an “Acceptance” (or not) trade entry beyond (or reversal) a key level.
Gold often moves fast, and does not print FVG-123 signals on the 1 min chart – That is why the 5 min CISD was included in this “MFB - Levels Confluence Gold OR” indicator version.
The other indicator I am considering for a 1 min chart VWAP, 9/20 EMA retrace trade entry is the “MFB – Value Acceptance” indicator.
Anyway. Learning along. Interesting.
Here is a “Luxalgo – Quant” description –
- The indicator (as the other indicators) works with the usual "Momentum Flow Build w/FVG v6 (Clean)" key levels. Giving thanks. Peace.
MFB - Levels Coherence - Gold OR
The MFB - Levels Coherence - Gold OR indicator retains the exact same powerful, logic-driven foundation as the original "Levels Coherence" indicator.
It acts as an active Session Guide designed to discern the most probable market direction by analyzing the immediate relationship between intraday Opening Ranges (Internal Liquidity) and significant historical boundaries (External Liquidity).
Just like the original, it uses the Confluence Distance (12 points) to classify setups:
• Confluence AOI (Sweep/Reversals): Price sweeps a clustered Opening Range and External Liquidity zone, rejects it, and forms a confirming FVG-123.
• Pathway Mode (Acceptance/Continuations): Price breaks clean outside an Opening Range that has no nearby External Liquidity, signaling true momentum.
What Makes the "Gold OR" Version Unique?
We tailored this version specifically for the unique rhythm of Gold Futures trading. Here are the key upgrades and custom default settings that were added:
1. Comex (Gold) Session Default:
• Instead of defaulting to the standard Equities/NY Open (09:30 AM ET), this version automatically targets the Comex Open with a dedicated 08:20–08:50 AM ET session block.
2. Tailored Opening Range Views:
• Gold traders often rely heavily on slightly higher timeframe boundaries. By default, the 15-minute Opening Range lines are turned off, keeping your chart clean. The indicator defaults to showing only the critical 30-minute and 1-hour Opening Range highs and lows.
• New Feature: You now have individual toggles and thickness controls for the 15m, 30m, and 1h lines, allowing you to perfectly customize the visual layout to your specific trading window.
3. The 5-Minute CISD Label:
• New Feature: We introduced a specific 5m CISD (Change in State of Delivery) mechanical label. If you are trading on the 5-minute chart, the indicator actively watches those 30m and 1h Opening Range boundaries. If price pierces one of those boundaries, closes back inside, and triggers a valid CISD crossover, a diamond "CISD" label will print on the chart—giving you an extra layer of structural confirmation right at the liquidity zone.
This version gives Gold traders the exact same disciplined liquidity filtering as the original, but perfectly tuned and out-of-the-box ready for the Comex open!
Peace -
Sürüm Notları
Peace – The MFB - Levels Coherence Indicator (Gold OR) has been improved to print the Stop loss and Take profit lines –I also worked with Luxalgo – Quant to test the strategy for trading specifically between 9am to 10am EST.
The time window was chosen for anyone who may not have time to trade the NY session, yet would like to try a routine of trading with a profitably tested indicator.
The Signals will still print at any hour, and the settings for opening range highs and lows are adjustable in the settings.
Anyway. We tried to create something encouraging.
My plan is to try a stop to break even at 1 to 1 Risk reward, or at the .50 (half way) between the high and low of the Opening range lines – as well as trailing stops to the nearest candle when price reaches 1 to 1 RR – The idea is to try and catch the trade before it reverses.
Here is the Luxalgo – Quant description.
Peace.
MFB - Levels Coherence (Gold OR) - Strategy & Indicator Setup
Why the SL and TP Lines are Helpful:
This updated version removes the guesswork from trade execution by visually plotting the exact Entry, Stop Loss (SL), and Take Profit (TP) levels directly on the chart using clear, color-coded dotted lines the moment a signal fires.
By dynamically calculating the SL based on the signal candle's extreme (high or low) and projecting a customizable Risk/Reward ratio (default 1:2) for the TP, it allows traders to instantly visualize their risk exposure and target without having to manually calculate or draw tools.
What the Signals Are:
The indicator generates highly selective, context-aware signals based on the Opening Range (OR) and key liquidity levels:
• Sweep Signals (Red/Green Triangles): Reversal setups that trigger when price manipulates (sweeps) a key level or the Opening Range boundary, forms an FVG, and then reclaims the zone.
• Pathway Signals (Red/Green Arrows): Continuation setups that trigger when price breaks outside the Opening Range and accepts the breakout, specifically when there is a clear "pathway" (greater than 12 points of distance) to the next major external liquidity draw.
• CISD Signals (Diamonds): Change in State of Delivery setups specifically tailored for the 5-minute chart, triggering when price sweeps the 30m or 1h Opening Range and then breaks market structure to close back inside.
How it was Tested (9:00 AM - 10:00 AM EST Gold Futures):
To validate this logic, the indicator was temporarily converted into a fully automated Pine Script® backtesting strategy applied to the Gold Futures (GC) 5-minute chart.
A strict time filter was applied so the algorithm could only take trades between 9:00 AM and 10:00 AM EST.
This specific 1-hour window was targeted because it captures the heavy influx of volume and momentum surrounding the New York equity open and the Comex session.
The backtest results produced a remarkably smooth and consistently profitable equity curve, proving that the Coherence Sweep and CISD logic is highly effective at identifying and capitalizing on the explosive liquidity grabs that routinely occur during this peak volatility hour on Gold.
Peace -
Sürüm Notları
Peace – I processed through ideas for a new version of the indicator that considers both 5 min chart trading signals, and 1 min chart 9 EMA retrace signals – with 5 min signal support.This particular default is meant to provide support to anyone trading the Comex opening range for Gold futures -
A good time window to catch signals for Gold futures "Opening Range" might be 8:30am EST to 10am EST?
Here is the Luxalgo Quant description that puts into words the ideas that we added to the indicator.
Peace –
Here is a complete, "Easy Breezy" guide to your newly upgraded MFB Coherence Indicator. You can save this reference for your own process or share it with other traders!
________________________________________
🧘♂️ "Easy Breezy" Trading: The Process is the Peace
This upgraded script removes the noise and gives you two highly focused, systematized ways to trade. We have consolidated the core logic into a Trading Mode Preset dropdown to help you switch contexts instantly without touching individual checkboxes.
🌟 New Add-Ons & Features
• 5m HTF Reading Box: A dynamic memory box at the top right of your chart. It constantly scans the 5-minute timeframe in the background and locks in the most recent structural signal (Bearish/Bullish CISD, Sweep, or Pathway).
• 9 EMA Retrace Signals: Automatic plotting of long/short entries when price crosses the 9/20 EMA and pulls back to touch the 9 EMA. Complete with Risk/Reward targeting lines.
• Smart Filtering: The 1-minute 9 EMA signals can be mathematically bound to the 5-minute HTF Reading Box. If the HTF is Bullish, the script will strictly ignore all Short 9 EMA setups.
• Recent Lines Only: A feature that automatically cleans your chart by deleting old entry/stop/target lines the moment a new signal fires.
• Visual 5m Signals on LTF: You can physically plot historical 5-minute signals (labeled "5m SW", "5m CISD", etc.) directly onto your 1-minute chart to visualize the higher timeframe shifts.
________________________________________
⚙️ The Trading Mode Presets
In the indicator settings, under Signal Toggles, you will find the Trading Mode Preset dropdown. This is your master switch for "Easy Breezy" trading.
Mode 1: "1 min 9 EMA with HTF Support"
The Goal: Execute high-probability momentum pullbacks on the 1-minute chart, strictly backed by 5-minute institutional structure.
• What it does: Automatically turns OFF the clutter of 5-minute structural shapes on your 1m chart. It turns ON the 9 EMA Retrace signals and forces the HTF Filter to activate.
• The Process:
1. Look at the top right of your chart: What does the HTF Reading Box say? (e.g., 5m Bullish Sweep).
2. Wait for price on the 1-minute chart to cross the EMAs in that direction.
3. When price pulls back to the 9 EMA, the indicator will print an entry triangle and your risk/reward lines.
4. Take the trade, knowing the Higher Timeframe is acting as the wind at your back.
Mode 2: "5 min Signals Only"
The Goal: Trade pure structural shifts and momentum directly on the 5-minute chart.
• What it does: Automatically turns ON Sweep, Pathway, and CISD signals, as well as the 9 EMA Retrace signals. It turns OFF the HTF filter (since you are already on the HTF).
• The Process:
1. Stay on the 5-minute chart.
2. Trade the structural setups: Sweeps (liquidity grabs turning into reversals), Pathways (trend continuation after OR breakouts), or CISDs (major structural shifts back inside the OR).
3. Use the 9 EMA Retrace signals as secondary scale-in opportunities or continuation trades once the 5-minute trend is clearly established by a Sweep or CISD.
Mode 3: "Custom"
The Goal: Build your own visual workspace.
• What it does: Hands control back to the individual checkboxes below the dropdown. Turn exactly what you want on or off.
________________________________________
The Process is the Peace. Stick to the preset that fits your session, trust the HTF agreement, and let the indicator do the heavy lifting!
Peace -
Sürüm Notları
Peace – I spent some time with Luxalgo – Quant to make the “MFB - Levels Coherence Indicator (Gold OR)” signals clearer.The improvement brings clarity to “Signals” and “Intention”.
Cool. I asked the platform to put into words what our chat conversation was, and how we think some improvements have been made.
Peace –
MFB - Levels Coherence Indicator: Clarity & Intention Update
Today’s updates represent a significant leap forward in how this indicator bridges the gap between market analysis and trade execution. We’ve refined the visual feedback to align perfectly with a professional, stress-free trading workflow by separating Directional Bias from Actionable Entry.
🌟 What Was Improved Today:
1. Targeted Signal Toggles: Added "Only 9 EMA" and "Only CISD" override toggles, allowing you to quickly filter out the noise and focus exclusively on your preferred entry mechanisms.
2. Historical Trade Tracking: Defaulted the "Only Show Most Recent Trade Lines" to unchecked, allowing you to visually backtest and review how previous setups played out over the session.
3. Intentional Line Drawing: The risk/reward trade management lines (Entry, Stop Loss, Target) are now strictly tied to your actual entry triggers—the CISD and 9 EMA Retrace.
🧠 The Logic: Separating Bias from Execution
Previously, every signal competed for your attention with the same level of visual urgency. Now, the logic reflects a mature, two-step trading approach:
• The Setup (Directional Bias): The Opening Range sweeps and Pathway breakouts act as your compass. When you see a Sweep (Triangle) or a Pathway (Arrow), the market is telling you its narrative. It says, "Liquidity was grabbed here," or "Momentum is breaking out here."
• The Trigger (Trade Entry): Rather than blindly entering on a bias, you wait for the market to prove its intention. The CISD proves the structural reversal after a sweep. The 9 EMA Retrace proves the momentum continuation after a breakout. Only when these exact, high-probability triggers occur does the indicator draw your trade lines.
🕊️ Cultivating a Peaceful Trading Mindset
Trading can easily become chaotic when you feel the need to react to every shape that prints on the chart. This new version is designed to cultivate a peaceful, mechanical mindset.
By visually separating the "idea" from the "action," you eliminate FOMO. When a sweep occurs, you no longer feel the anxiety of needing to click buy or sell immediately to catch the bottom.
Instead, you can sit back, breathe, and simply wait for the CISD diamond or the 9 EMA pullback to appear.
This update transforms the indicator from a simple signal generator into a complete, disciplined trade management system. It encourages patience, objective execution, and ultimately, peace of mind at the charts.
Peace -
Sürüm Notları
Peace – I noticed a few things during a trading session, so I worked with Luxalgo – Quant to add all times frames to the alerts, and CISD labels improvement according to the trade session that is selected in the settings.Cool. Here is the Luxalgo description of our chat. Peace.
Here is a summary of the adjustments we made to the indicator to better support your mechanical trading process for Gold Futures (9 EMA Retrace & CISD):
MFB - Levels Coherence Indicator (Gold OR) - Updates
1. Unrestricted CISD Identification at Key Levels
• The Adjustment:
The 5m CISD (Change in State of Delivery) logic was decoupled from session constraints and the 12-point confluence rule. It now actively monitors for sweeps at all defined key levels (Daily, Weekly, Monthly, Asia, London, 15m/30m/1h ORs).
• The Process: This ensures a purely mechanical approach. Whenever price sweeps a key level and then closes back inside, the CISD setup is immediately primed for a reversal signal, regardless of the time of day. This captures critical liquidity grabs across all sessions without arbitrary filtering.
2. Timeframe-Agnostic Signal Generation & Alerts
• The Adjustment: Hardcoded timeframe restrictions (like is_5m) were removed from both the CISD and 9 EMA Retrace execution variables.
• The Process: The indicator is now fully adaptable. Alerts and visual signals for both CISD and 9 EMA Retraces will trigger based on the chart's active timeframe. If you are tracking the 9 EMA on a 1m chart or a 5m chart, the mechanical rules apply seamlessly to the timeframe you are trading, allowing for dynamic entry execution across multiple timeframes.
3. Enhanced Visual Clarity (CISD Labels)
• The Adjustment: The visual markers for CISD signals were upgraded from basic diamonds to prominent, solid-colored labels (shape.labelup and shape.labeldown with white text).
• The Process: "The Process is the peace." Trading mechanically requires immediate, unambiguous visual confirmation. The new labels stand out sharply against the chart background and clearly point to the triggering candle, removing any guesswork or hesitation when reading the chart in real-time.
These updates streamline the indicator, ensuring it acts as a strict, rule-based tool for identifying liquidity sweeps (CISD) and trend continuation (9 EMA) in the Gold Futures market.
Peace -
Açık kaynak kodlu komut dosyası
Gerçek TradingView ruhuyla, bu komut dosyasının mimarı, yatırımcıların işlevselliğini inceleyip doğrulayabilmesi için onu açık kaynaklı hale getirdi. Yazarı tebrik ederiz! Ücretsiz olarak kullanabilseniz de, kodu yeniden yayınlamanın Topluluk Kurallarımıza tabi olduğunu unutmayın.

Feragatname
Bilgiler ve yayınlar, TradingView tarafından sağlanan veya onaylanan finansal, yatırım, alım satım veya diğer türden tavsiye veya öneriler anlamına gelmez ve teşkil etmez. Kullanım Koşulları bölümünde daha fazlasını okuyun.
Açık kaynak kodlu komut dosyası
Gerçek TradingView ruhuyla, bu komut dosyasının mimarı, yatırımcıların işlevselliğini inceleyip doğrulayabilmesi için onu açık kaynaklı hale getirdi. Yazarı tebrik ederiz! Ücretsiz olarak kullanabilseniz de, kodu yeniden yayınlamanın Topluluk Kurallarımıza tabi olduğunu unutmayın.
Feragatname
Bilgiler ve yayınlar, TradingView tarafından sağlanan veya onaylanan finansal, yatırım, alım satım veya diğer türden tavsiye veya öneriler anlamına gelmez ve teşkil etmez. Kullanım Koşulları bölümünde daha fazlasını okuyun.