Güncellendi
[blackcat] L2 Ehlers Adaptive Stochastic
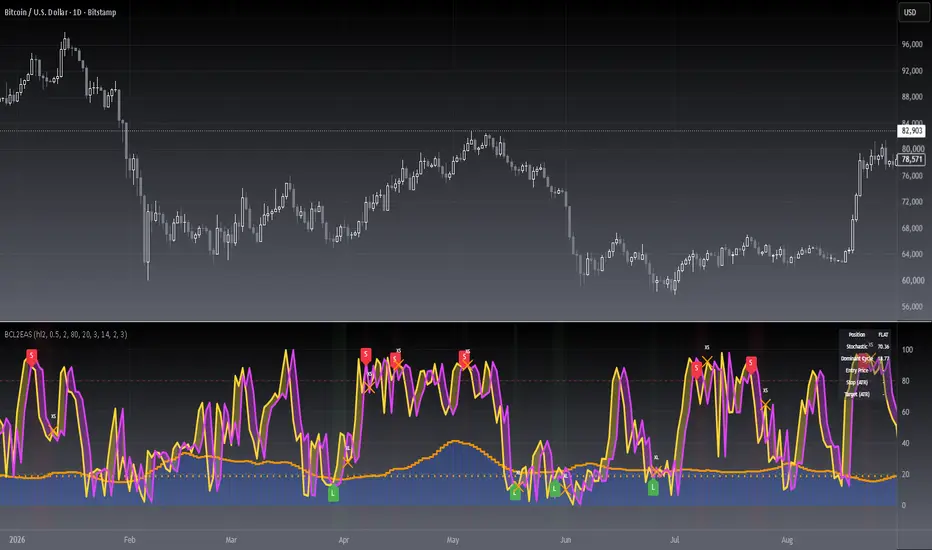
Level: 2
Background
John F. Ehlers introuced Adaptive Stochastic in his "Rocket Science for Traders" chapter 21 on 2001.
Function
The Stochastic measures the current closing price relative to the lowest low over the observation period. It then normalizes this to the range between the highest high and the lowest low over the observation period. If the current closing price is equal to the highest high over the observation period, then the Stochastic has a value of 1. If the current closing price is equal to the lowest low over the observation period, then the Stochastic has a value of zero. These are the limits over which the Stochastic can range. To optimize the Stochastic for the measured cycle, the correct fraction of the cycle to use is one-half, as the Stochastic can
range from its minimum to its maximum on each half cycle of the period. As before, the code for the optimized Stochastic measures the cycle period using the Homodyne Discriminator algorithm and then uses that period as the basis for finding HH and LL and computing the Stochastic. Since half the cycle period may not be the universal answer, we include a CycPart input as a modifier. This input allows you to optimize the observation period for each particular situation. The optimized Stochastic tends to be in phase with the original price data. This suggests a way to turn a good indicator into a great one. If we subtract 50 from the optimized Stochastic, we would get a zero mean and thus tend to have Poisson-like statistics on the Stochastic’s zero crossings. If that were the case, we could smooth the optimized Stochastic and make an Optimum Predictive filter from it. That way we could anticipate signals rather than wait for signals to cross the 20 percent and 80 percent marks for confirmation as is done with the standard indicator. I will leave it to you to decide which method best suits your needs and purposes.
Key Signal
Stochastic ---> Stochastic fast line
Stochastic[2] ---> Stochastic slow line
Pros and Cons
100% John F. Ehlers definition translation of original work, even variable names are the same. This help readers who would like to use pine to read his book. If you had read his works, then you will be quite familiar with my code style.
Remarks
The 19th script for Blackcat1402 John F. Ehlers Week publication.
Readme
In real life, I am a prolific inventor. I have successfully applied for more than 60 international and regional patents in the past 12 years. But in the past two years or so, I have tried to transfer my creativity to the development of trading strategies. Tradingview is the ideal platform for me. I am selecting and contributing some of the hundreds of scripts to publish in Tradingview community. Welcome everyone to interact with me to discuss these interesting pine scripts.
The scripts posted are categorized into 5 levels according to my efforts or manhours put into these works.
Level 1 : interesting script snippets or distinctive improvement from classic indicators or strategy. Level 1 scripts can usually appear in more complex indicators as a function module or element.
Level 2 : composite indicator/strategy. By selecting or combining several independent or dependent functions or sub indicators in proper way, the composite script exhibits a resonance phenomenon which can filter out noise or fake trading signal to enhance trading confidence level.
Level 3 : comprehensive indicator/strategy. They are simple trading systems based on my strategies. They are commonly containing several or all of entry signal, close signal, stop loss, take profit, re-entry, risk management, and position sizing techniques. Even some interesting fundamental and mass psychological aspects are incorporated.
Level 4 : script snippets or functions that do not disclose source code. Interesting element that can reveal market laws and work as raw material for indicators and strategies. If you find Level 1~2 scripts are helpful, Level 4 is a private version that took me far more efforts to develop.
Level 5 : indicator/strategy that do not disclose source code. private version of Level 3 script with my accumulated script processing skills or a large number of custom functions. I had a private function library built in past two years. Level 5 scripts use many of them to achieve private trading strategy.
Background
John F. Ehlers introuced Adaptive Stochastic in his "Rocket Science for Traders" chapter 21 on 2001.
Function
The Stochastic measures the current closing price relative to the lowest low over the observation period. It then normalizes this to the range between the highest high and the lowest low over the observation period. If the current closing price is equal to the highest high over the observation period, then the Stochastic has a value of 1. If the current closing price is equal to the lowest low over the observation period, then the Stochastic has a value of zero. These are the limits over which the Stochastic can range. To optimize the Stochastic for the measured cycle, the correct fraction of the cycle to use is one-half, as the Stochastic can
range from its minimum to its maximum on each half cycle of the period. As before, the code for the optimized Stochastic measures the cycle period using the Homodyne Discriminator algorithm and then uses that period as the basis for finding HH and LL and computing the Stochastic. Since half the cycle period may not be the universal answer, we include a CycPart input as a modifier. This input allows you to optimize the observation period for each particular situation. The optimized Stochastic tends to be in phase with the original price data. This suggests a way to turn a good indicator into a great one. If we subtract 50 from the optimized Stochastic, we would get a zero mean and thus tend to have Poisson-like statistics on the Stochastic’s zero crossings. If that were the case, we could smooth the optimized Stochastic and make an Optimum Predictive filter from it. That way we could anticipate signals rather than wait for signals to cross the 20 percent and 80 percent marks for confirmation as is done with the standard indicator. I will leave it to you to decide which method best suits your needs and purposes.
Key Signal
Stochastic ---> Stochastic fast line
Stochastic[2] ---> Stochastic slow line
Pros and Cons
100% John F. Ehlers definition translation of original work, even variable names are the same. This help readers who would like to use pine to read his book. If you had read his works, then you will be quite familiar with my code style.
Remarks
The 19th script for Blackcat1402 John F. Ehlers Week publication.
Readme
In real life, I am a prolific inventor. I have successfully applied for more than 60 international and regional patents in the past 12 years. But in the past two years or so, I have tried to transfer my creativity to the development of trading strategies. Tradingview is the ideal platform for me. I am selecting and contributing some of the hundreds of scripts to publish in Tradingview community. Welcome everyone to interact with me to discuss these interesting pine scripts.
The scripts posted are categorized into 5 levels according to my efforts or manhours put into these works.
Level 1 : interesting script snippets or distinctive improvement from classic indicators or strategy. Level 1 scripts can usually appear in more complex indicators as a function module or element.
Level 2 : composite indicator/strategy. By selecting or combining several independent or dependent functions or sub indicators in proper way, the composite script exhibits a resonance phenomenon which can filter out noise or fake trading signal to enhance trading confidence level.
Level 3 : comprehensive indicator/strategy. They are simple trading systems based on my strategies. They are commonly containing several or all of entry signal, close signal, stop loss, take profit, re-entry, risk management, and position sizing techniques. Even some interesting fundamental and mass psychological aspects are incorporated.
Level 4 : script snippets or functions that do not disclose source code. Interesting element that can reveal market laws and work as raw material for indicators and strategies. If you find Level 1~2 scripts are helpful, Level 4 is a private version that took me far more efforts to develop.
Level 5 : indicator/strategy that do not disclose source code. private version of Level 3 script with my accumulated script processing skills or a large number of custom functions. I had a private function library built in past two years. Level 5 scripts use many of them to achieve private trading strategy.
Sürüm Notları
OVERVIEWThis script implements the Ehlers Adaptive Stochastic indicator, designed to provide dynamic stochastic oscillations based on market cycles. It combines advanced signal processing techniques with traditional stochastic calculations for enhanced market timing.
FEATURES
• Adaptive cycle detection using Hilbert Transform
• Dynamic price range calculation
• Dual-stochastic visualization
• Color-coded divergence highlighting
• Customizable price source and cycle parameters
HOW TO USE
Select your preferred price source from the input parameters
Adjust the Cycle Part parameter to fine-tune sensitivity
Monitor the stochastic values for overbought/oversold conditions
Look for divergences between price action and stochastic movements
INPUT PARAMETERS
• Price Source: Default is hl2 (midpoint of high and low)
• Cycle Part: Controls the lookback period for cycle detection (default 0.5)
VISUALIZATION
• Blue columns: Smoothed cycle period
• Orange line: Real-time cycle tracking
• Yellow line: Current stochastic value
• Fuchsia line: Lagging stochastic value
• Background fill: Color-coded divergence areas
LIMITATIONS
• Requires sufficient historical data for accurate calculations
• Performance may vary in highly volatile markets
• Parameter optimization needed for different timeframes
NOTES
• Based on John Ehlers' adaptive cycle theory
• Incorporates Hilbert Transform for phase analysis
• Suitable for both trending and ranging markets
Sürüm Notları
█ OVERVIEWThis open-source indicator is an adaptive stochastic oscillator that measures price position within a cycle-length window that automatically follows the market's dominant cycle. Version 2 upgrades the original with complete long/short entry and exit signals, a position state machine, ATR-based risk levels, a status dashboard, and a full alert system.
█ CONCEPTS
The script estimates the market's dominant cycle with a Hilbert Transform approach (smoothing, detrending, phasor arithmetic, and a homodyne discriminator), then uses the resulting cycle period to size the lookback window of a stochastic calculation. Because the window adapts to the cycle, the oscillator stays responsive in fast markets and stable in slow ones.
Key principles:
• Adaptive Window: the stochastic lookback follows the dominant cycle instead of a fixed bar count
• Zone-Confirmed Crossings: long entries require a golden cross in the oversold zone; short entries require a dead cross in the overbought zone
• Signal Governance: a position state machine enforces entry/exit exclusivity, an adjustable cooldown, and one state change per bar
█ HOW TO USE
1 — Add the indicator to a standard candlestick chart; it opens in its own pane below the price
2 — Tune the Core and Signal groups if needed; the defaults work out of the box on most liquid markets
3 — Read signals from the labels, track position state from the background color and the dashboard, and confirm levels in the Data Window
Input Parameters
• Price Source: source fed to the adaptive engine (default hl2)
• Cycle Part: fraction of the dominant cycle used as the stochastic window (default 0.5, range 0.125 to 1.0)
• Lag Bars: offset of the reference line used for crossovers (default 2)
• Overbought / Oversold Level: zone thresholds for short and long entries (defaults 80 and 20)
• Enable Short Signals: toggle the mirrored short side on or off (default on)
• Same-bar Entry/Exit Exclusivity: prevents entry and exit from firing on the same bar (default on)
• Cooldown Bars: minimum bars between two signal actions, 0 disables (default 3)
• ATR Length / Stop Loss (xATR) / Take Profit (xATR): volatility-based risk levels shown per open position
• Show TP/SL Levels, Show Signal Labels, Show Position Background, Show Dashboard: display toggles
█ FEATURES
• Complete trade loop: long entry, short entry, and reverse-crossing exits, all filtered by the state machine
• ATR stop-loss and take-profit reference levels for every open position
• Six alert channels: four alertcondition events plus dynamic close-confirmed alert() messages
• Status dashboard table: position, stochastic value, dominant cycle, entry price, stop and target
• Clean color semantics: green for long, red for short, orange for exits
█ SIGNALS
Visual Elements
• Stochastic (yellow) and Stochastic Lag (fuchsia): the oscillator pair; the shaded fill marks which line leads
• Dominant Cycle (orange step line with blue columns): the adaptive cycle length driving the window
• L label: long entry on an oversold-zone golden cross
• S label: short entry on an overbought-zone dead cross
• XL / XS cross labels: long and short exits on an opposite crossing
• Background tint: light green while long, light red while short
• Dashed levels: the configured overbought and oversold thresholds
█ IMPLEMENTATION NOTES
The cycle estimator is built from ta-style smoothing and the homodyne discriminator; crossovers use ta.crossover and ta.crossunder, and risk levels use ta.atr. All alert() calls use alert.freq_once_per_bar_close, so alert semantics match bar-close confirmation and do not repaint. Stop and target prices are price-scale values, so they are reported in the Data Window and dashboard rather than drawn on the 0 to 100 oscillator scale.
█ LIMITATIONS
• Ranging markets can produce whipsaw crossings; raise Cooldown Bars or widen the zone thresholds to filter noise
• The oscillator is unbounded in theory but typically swings within 0 to 100; extreme windows during low-liquidity bars may distort readings
• Signals confirm at bar close; intrabar values may change until then
• Stop and target levels are reference points for discretionary use, not automated orders
█ NOTES
• Released under Mozilla Public License 2.0; original concept by blackcat1402
• Version 2 is a polished edition of the open-source original with signal, risk, and visualization completeness
• Backtest thoroughly on your symbol and timeframe before trading any signal
═════════════════════════════════════════════════════════════════════════
For questions or feedback, use the comments section below.
Feel free to use and modify — attribution appreciated.

Don't miss out! The first and most important thing to do is to join my Discord chat now! Click here to start your adventure: discord.com/invite/ZTGpQJq My new github for more pine development soon: github.com/wxt-coder
Feragatname
Bilgiler ve yayınlar, TradingView tarafından sağlanan veya onaylanan finansal, yatırım, alım satım veya diğer türden tavsiye veya öneriler anlamına gelmez ve teşkil etmez. Kullanım Koşulları bölümünde daha fazlasını okuyun.
Don't miss out! The first and most important thing to do is to join my Discord chat now! Click here to start your adventure: discord.com/invite/ZTGpQJq My new github for more pine development soon: github.com/wxt-coder
Feragatname
Bilgiler ve yayınlar, TradingView tarafından sağlanan veya onaylanan finansal, yatırım, alım satım veya diğer türden tavsiye veya öneriler anlamına gelmez ve teşkil etmez. Kullanım Koşulları bölümünde daha fazlasını okuyun.