Güncellendi
KRV NQ Execution Matrix | Multi-Timeframe Signals for NQ and MNQ
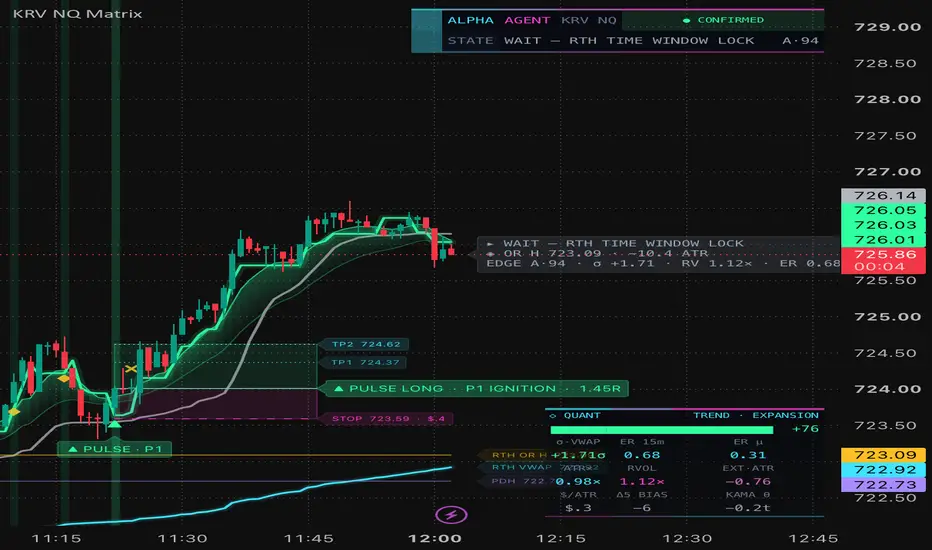
KRV NQ Execution Matrix is a signal and trade-planning tool for Nasdaq-100 futures (NQ and MNQ) on 45-second and 1-minute charts.
This is the open-source release of my earlier protected script, KRV NQ Execution Matrix v1.1. The protected version stays online because TradingView does not allow published scripts to be removed. This version is the one I will maintain. Compared with the protected version, it adds:
- the full source code, open for review
- a redesigned interface (state panel, quant panel, label next to price, plan zones)
- a fix for the 18:00 New York Globex reset, which could be skipped on some days
- a lock that disables signals on non-standard chart types
- bar-close confirmation on every alert in Confirmed Bar mode
- a warm-up period, so nothing fires during the chart's first partial session
- an adjustable signal limit per session (default effectively unlimited; the cooldown still spaces signals)
It will not print a signal just because the fast chart moved. The 15-minute trend and the 5-minute structure must agree on a direction first. Only then does it look for a specific trigger on your chart, and every signal it prints comes with a full plan: entry, a stop based on recent structure, two targets, the reward-to-risk ratio and the dollar risk.
On a quiet or two-sided day it stays silent. That is by design.
HOW IT WORKS
Each layer has to give permission before the next one can act.
1) 15-minute command
Using the last completed 15-minute bar, the script scores which side is in control. It looks at the 21 and 55 EMA stack and slope, an adaptive moving average (KAMA), the efficiency ratio (how clean the trend is compared with the noise), an ATR ratio (whether volatility is expanding) and which side of the session VWAP price is on. A side needs a score of at least 65 by default and must beat the other side.
2) 5-minute structure
Using the last completed 5-minute bar, it checks that the structure supports the command: EMA stack and slope, VWAP side, acceptance above or below the session opening range, and impulse strength. Default minimum score: 60.
3) Matrix direction
The Matrix is LONG or SHORT only when the 15-minute and 5-minute layers agree. While it is neutral, nothing can arm or fire.
4) Core setups
On the execution chart the script scores four setup types: a pullback to VWAP or KAMA, a retest of the opening range, a breakout from a tight range, and a failed auction (price sweeps the prior-day high or low, the session high or low, or the opening range, then reclaims it). Before a setup can arm it must also pass a risk check: at least 1.35R to target, and a stop no wider than 1.75 ATR by default.
5) MicroPulse
A short-term momentum module that only works in the Matrix direction. It looks for three patterns:
- P1 Ignition: price breaks the last few bars with a strong candle
- P2 Pullback Reclaim: price dips into the fast EMAs and reclaims them
- P3 Compression Release: a tight range breaks in the Matrix direction
Each pattern uses an adaptive trailing line, limits on how clean the move is and how far price has already run, and separate scores to arm and to fire. After a pulse fires, the script follows it for a short model ride (3 bars by default) and marks a model exit when the pulse fails or the ride ends.
6) Guard rails
A cooldown between signals (14 bars by default), trade windows during regular hours (09:45 to 11:30 and 13:30 to 15:45 New York time by default, adjustable), optional overnight windows, an optional signal limit per session, and automatic locks for the wrong timeframe, non-standard chart types and the warm-up period.
WHY THESE PIECES ARE COMBINED
Each piece answers one question, and a signal needs a yes from all of them:
- 15-minute and 5-minute layers: which side is in control?
- Session map (VWAP, opening ranges, prior-day and overnight levels): where are the levels that matter today?
- Core setups and MicroPulse: is there a specific trigger right now?
- Risk check: is the trade structurally sound (stop width, distance to target, reward-to-risk)?
EMAs, KAMA, VWAP and ATR are standard tools. The original part is the gating: the scores, the thresholds and the order in which each layer is allowed to act.
HOW TO READ THE CHART
- Yellow diamond or circle: a setup has armed and is waiting for its trigger.
- Small triangle under or over a bar: a signal. Every signal keeps its triangle, so you can scroll back and see all of them.
- PULSE or MATRIX tag: the most recent signals. Hover a tag to see its full plan.
- Shaded zones: entry, stop, TP1 and TP2 for the latest signal (magenta is risk, green is reward).
- Yellow X: the model exit for a pulse.
- Step line and shaded ribbon (green for long, magenta for short): the pulse trailing line and the fast EMA ribbon. They only appear when the Matrix has a direction.
- Top-right panel: current state and edge grade. Turn off "Minimize HUD" in the settings for the full panel (15m / 5m / MicroPulse alignment, edge meter, next action, active plan).
- Bottom-right panel: bias history, distance from VWAP in standard deviations, efficiency ratios, volatility ratio, relative volume, stretch from the fast EMA, dollar value of one ATR, change in bias and KAMA slope. These are readings, not signals.
- Label next to price: the current state, the trigger or plan, the nearest session level and key readings.
SUGGESTED SETUP
- NQ1! or MNQ1! on a 45-second or 1-minute chart with standard candles. The script reads the 15-minute and 5-minute data internally.
- Chart settings, Canvas, Margins: top 10%, bottom 10%, right 70 bars (around 60 on a smaller screen). The panels then sit in empty space.
- Right-click the price scale and turn on "Scale price chart only" so far-away levels never squeeze the chart.
- Set alerts to "Once Per Bar Close".
ALERTS
PULSE LONG NOW / PULSE SHORT NOW, PULSE EXIT LONG / SHORT, LONG NOW / SHORT NOW (core setups), MICRO LONG / SHORT ARMED, and LONG / SHORT COMMAND.
REPAINTING AND DATA
- In Confirmed Bar mode (the default), signals, exits, plans, markers and alerts all wait for the bar to close. They look the same on historical bars as they did live.
- 15-minute and 5-minute values come from request.security() with a one-bar offset and lookahead on, which returns only the last completed bar. This is the non-repainting method described in TradingView's documentation. No future data is used.
- The panels, the label next to price and the ribbon update during the live bar, like any oscillator, and settle when the bar closes.
- Live Bar mode is optional. It gives an early heads-up that can change before the bar closes.
- Warm-up: the first session on the chart starts part-way through, so session levels are hidden and no signals are generated until the first full session opens (18:00 New York time, or 09:30 on charts without extended hours). The top-right panel shows WARM-UP while this is active.
LIMITATIONS
- Built and tuned for NQ and MNQ. It is not calibrated for other markets.
- Signals are turned off on non-standard charts (Heikin-Ashi, Renko, Range, Kagi, Point and Figure, Line Break) and on timeframes above the execution limit. A red warning on the chart says why.
- Stops, targets, the ride length and exits are model guidance. The script does not know your actual position, fills or slippage.
- Dollar risk uses the contract point value and the contract count in the settings, before commissions and slippage.
- Past signals do not predict future results. This is an analysis tool, not financial advice.
This is the open-source release of my earlier protected script, KRV NQ Execution Matrix v1.1. The protected version stays online because TradingView does not allow published scripts to be removed. This version is the one I will maintain. Compared with the protected version, it adds:
- the full source code, open for review
- a redesigned interface (state panel, quant panel, label next to price, plan zones)
- a fix for the 18:00 New York Globex reset, which could be skipped on some days
- a lock that disables signals on non-standard chart types
- bar-close confirmation on every alert in Confirmed Bar mode
- a warm-up period, so nothing fires during the chart's first partial session
- an adjustable signal limit per session (default effectively unlimited; the cooldown still spaces signals)
It will not print a signal just because the fast chart moved. The 15-minute trend and the 5-minute structure must agree on a direction first. Only then does it look for a specific trigger on your chart, and every signal it prints comes with a full plan: entry, a stop based on recent structure, two targets, the reward-to-risk ratio and the dollar risk.
On a quiet or two-sided day it stays silent. That is by design.
HOW IT WORKS
Each layer has to give permission before the next one can act.
1) 15-minute command
Using the last completed 15-minute bar, the script scores which side is in control. It looks at the 21 and 55 EMA stack and slope, an adaptive moving average (KAMA), the efficiency ratio (how clean the trend is compared with the noise), an ATR ratio (whether volatility is expanding) and which side of the session VWAP price is on. A side needs a score of at least 65 by default and must beat the other side.
2) 5-minute structure
Using the last completed 5-minute bar, it checks that the structure supports the command: EMA stack and slope, VWAP side, acceptance above or below the session opening range, and impulse strength. Default minimum score: 60.
3) Matrix direction
The Matrix is LONG or SHORT only when the 15-minute and 5-minute layers agree. While it is neutral, nothing can arm or fire.
4) Core setups
On the execution chart the script scores four setup types: a pullback to VWAP or KAMA, a retest of the opening range, a breakout from a tight range, and a failed auction (price sweeps the prior-day high or low, the session high or low, or the opening range, then reclaims it). Before a setup can arm it must also pass a risk check: at least 1.35R to target, and a stop no wider than 1.75 ATR by default.
5) MicroPulse
A short-term momentum module that only works in the Matrix direction. It looks for three patterns:
- P1 Ignition: price breaks the last few bars with a strong candle
- P2 Pullback Reclaim: price dips into the fast EMAs and reclaims them
- P3 Compression Release: a tight range breaks in the Matrix direction
Each pattern uses an adaptive trailing line, limits on how clean the move is and how far price has already run, and separate scores to arm and to fire. After a pulse fires, the script follows it for a short model ride (3 bars by default) and marks a model exit when the pulse fails or the ride ends.
6) Guard rails
A cooldown between signals (14 bars by default), trade windows during regular hours (09:45 to 11:30 and 13:30 to 15:45 New York time by default, adjustable), optional overnight windows, an optional signal limit per session, and automatic locks for the wrong timeframe, non-standard chart types and the warm-up period.
WHY THESE PIECES ARE COMBINED
Each piece answers one question, and a signal needs a yes from all of them:
- 15-minute and 5-minute layers: which side is in control?
- Session map (VWAP, opening ranges, prior-day and overnight levels): where are the levels that matter today?
- Core setups and MicroPulse: is there a specific trigger right now?
- Risk check: is the trade structurally sound (stop width, distance to target, reward-to-risk)?
EMAs, KAMA, VWAP and ATR are standard tools. The original part is the gating: the scores, the thresholds and the order in which each layer is allowed to act.
HOW TO READ THE CHART
- Yellow diamond or circle: a setup has armed and is waiting for its trigger.
- Small triangle under or over a bar: a signal. Every signal keeps its triangle, so you can scroll back and see all of them.
- PULSE or MATRIX tag: the most recent signals. Hover a tag to see its full plan.
- Shaded zones: entry, stop, TP1 and TP2 for the latest signal (magenta is risk, green is reward).
- Yellow X: the model exit for a pulse.
- Step line and shaded ribbon (green for long, magenta for short): the pulse trailing line and the fast EMA ribbon. They only appear when the Matrix has a direction.
- Top-right panel: current state and edge grade. Turn off "Minimize HUD" in the settings for the full panel (15m / 5m / MicroPulse alignment, edge meter, next action, active plan).
- Bottom-right panel: bias history, distance from VWAP in standard deviations, efficiency ratios, volatility ratio, relative volume, stretch from the fast EMA, dollar value of one ATR, change in bias and KAMA slope. These are readings, not signals.
- Label next to price: the current state, the trigger or plan, the nearest session level and key readings.
SUGGESTED SETUP
- NQ1! or MNQ1! on a 45-second or 1-minute chart with standard candles. The script reads the 15-minute and 5-minute data internally.
- Chart settings, Canvas, Margins: top 10%, bottom 10%, right 70 bars (around 60 on a smaller screen). The panels then sit in empty space.
- Right-click the price scale and turn on "Scale price chart only" so far-away levels never squeeze the chart.
- Set alerts to "Once Per Bar Close".
ALERTS
PULSE LONG NOW / PULSE SHORT NOW, PULSE EXIT LONG / SHORT, LONG NOW / SHORT NOW (core setups), MICRO LONG / SHORT ARMED, and LONG / SHORT COMMAND.
REPAINTING AND DATA
- In Confirmed Bar mode (the default), signals, exits, plans, markers and alerts all wait for the bar to close. They look the same on historical bars as they did live.
- 15-minute and 5-minute values come from request.security() with a one-bar offset and lookahead on, which returns only the last completed bar. This is the non-repainting method described in TradingView's documentation. No future data is used.
- The panels, the label next to price and the ribbon update during the live bar, like any oscillator, and settle when the bar closes.
- Live Bar mode is optional. It gives an early heads-up that can change before the bar closes.
- Warm-up: the first session on the chart starts part-way through, so session levels are hidden and no signals are generated until the first full session opens (18:00 New York time, or 09:30 on charts without extended hours). The top-right panel shows WARM-UP while this is active.
LIMITATIONS
- Built and tuned for NQ and MNQ. It is not calibrated for other markets.
- Signals are turned off on non-standard charts (Heikin-Ashi, Renko, Range, Kagi, Point and Figure, Line Break) and on timeframes above the execution limit. A red warning on the chart says why.
- Stops, targets, the ride length and exits are model guidance. The script does not know your actual position, fills or slippage.
- Dollar risk uses the contract point value and the contract count in the settings, before commissions and slippage.
- Past signals do not predict future results. This is an analysis tool, not financial advice.
Sürüm Notları
**v1.1 — Session Initialization and RTH/ETH Compatibility**This maintenance update addresses session-boundary handling in the KRV NQ Execution Matrix, particularly when using regular-trading-hours-only (RTH) chart data.
**Changes**
- Revised new-session detection to recognize daily RTH transitions when overnight bars are not present in the chart's dataset.
- Corrected warm-up initialization logic to prevent the execution engine from remaining locked while waiting for an unavailable overnight session transition.
- Improved prior-session high/low rollover handling so completed-session reference levels are retained before the new session begins.
- Refined session classification to avoid treating RTH-only feed boundaries as executable extended-hours periods.
**Unchanged Components**
The 15-minute Command Layer, 5-minute Structure Layer, Matrix Core, MicroPulse P1/P2/P3 setups, scoring thresholds, risk/target calculations, alert conditions, and visual presentation have not been intentionally modified.
**Usage and Limitations**
The indicator remains designed for standard NQ/MNQ price charts using 45-second or 1-minute execution intervals, with higher-timeframe context calculated internally.
RTH-only chart data does not contain the complete overnight trading session. Overnight auction levels cannot be reconstructed from unavailable bars.
These changes address session-state compatibility. They do not introduce new trading signals, change the intended entry methodology, or imply improved historical profitability.

Feragatname
Bilgiler ve yayınlar, TradingView tarafından sağlanan veya onaylanan finansal, yatırım, alım satım veya diğer türden tavsiye veya öneriler anlamına gelmez ve teşkil etmez. Kullanım Koşulları bölümünde daha fazlasını okuyun.
Feragatname
Bilgiler ve yayınlar, TradingView tarafından sağlanan veya onaylanan finansal, yatırım, alım satım veya diğer türden tavsiye veya öneriler anlamına gelmez ve teşkil etmez. Kullanım Koşulları bölümünde daha fazlasını okuyun.