True Opens [Pro +]
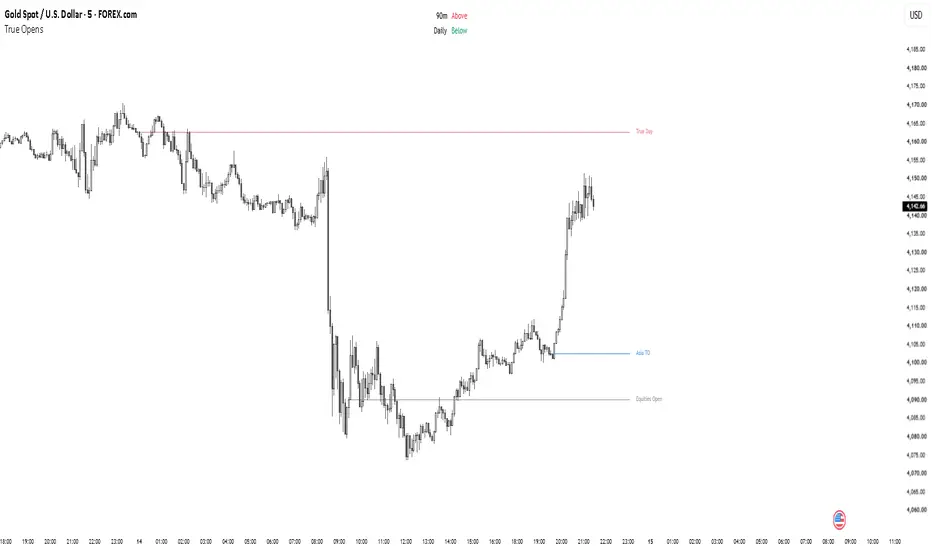
True Opens [Pro +] — Multi-Cycle Quarterly Theory Open Levels
True Opens [Pro +] is a discretionary analysis toolkit that plots key open levels from several Quarterly Theory time cycles directly on your chart, and shows whether price is currently trading above or below each one. It does not generate buy/sell recommendations, does not predict future price, and is not a signal service. Every module is a visual and analytical aid meant to support the trader's own decision-making process.
WHAT IT DOES
Cyclic Opens — five independent open levels, each with its own on/off switch: Micro, 90m (session-based: Asia, London, NY and PM), Daily, Weekly and Monthly. Each level is drawn as a horizontal line with an optional label and extends forward past the current bar.
Reference Opens — optional fixed-time levels that are not part of the cyclic model: 8:30, 9:30, 10:00, 18:00, and a Dynamic Weekly Open that adapts to the instrument's week start.
Smart Visibility — Auto mode shows each level only on timeframes where it is useful, keeping the chart clean. Custom mode lets you set your own minimum and maximum timeframe for every level.
Bias Table — a compact table listing each active cyclic open and whether price is currently above or below it. Position, text size and colors are adjustable.
Labels — three presets: Auto (session-specific names), Custom Names (your own text for every level) or Time (the time the open was captured). Label visibility and size are adjustable.
Line Styling — Auto style changes the line appearance as the cycle progresses, or choose a fixed solid, dashed or dotted style. Line thickness and a separate color for each level are available.
Historical Opens — optionally keep past opens on the chart with a maximum count per cycle, so older levels are cleaned up automatically.
Alerts — cross alerts for each cyclic open, and bias-change alerts (changed to Above / changed to Below) for each cycle, all available as alertcondition() entries.
HOW TO USE IT
Every level has its own switch, so the indicator can be reduced to only the parts you actually use. Enable the cycles that fit your framework, choose Auto or Custom visibility, then pick the label and line style you prefer. Turn on the Bias Table for a quick read of where price sits relative to each open, and set up alerts for the levels you watch.
DISCLAIMER
This script is provided for educational and analytical purposes only. It does not constitute financial advice, and past patterns identified by any module do not guarantee future results. Always combine this tool with your own risk management and due diligence.
True Opens [Pro +] is a discretionary analysis toolkit that plots key open levels from several Quarterly Theory time cycles directly on your chart, and shows whether price is currently trading above or below each one. It does not generate buy/sell recommendations, does not predict future price, and is not a signal service. Every module is a visual and analytical aid meant to support the trader's own decision-making process.
WHAT IT DOES
Cyclic Opens — five independent open levels, each with its own on/off switch: Micro, 90m (session-based: Asia, London, NY and PM), Daily, Weekly and Monthly. Each level is drawn as a horizontal line with an optional label and extends forward past the current bar.
Reference Opens — optional fixed-time levels that are not part of the cyclic model: 8:30, 9:30, 10:00, 18:00, and a Dynamic Weekly Open that adapts to the instrument's week start.
Smart Visibility — Auto mode shows each level only on timeframes where it is useful, keeping the chart clean. Custom mode lets you set your own minimum and maximum timeframe for every level.
Bias Table — a compact table listing each active cyclic open and whether price is currently above or below it. Position, text size and colors are adjustable.
Labels — three presets: Auto (session-specific names), Custom Names (your own text for every level) or Time (the time the open was captured). Label visibility and size are adjustable.
Line Styling — Auto style changes the line appearance as the cycle progresses, or choose a fixed solid, dashed or dotted style. Line thickness and a separate color for each level are available.
Historical Opens — optionally keep past opens on the chart with a maximum count per cycle, so older levels are cleaned up automatically.
Alerts — cross alerts for each cyclic open, and bias-change alerts (changed to Above / changed to Below) for each cycle, all available as alertcondition() entries.
HOW TO USE IT
Every level has its own switch, so the indicator can be reduced to only the parts you actually use. Enable the cycles that fit your framework, choose Auto or Custom visibility, then pick the label and line style you prefer. Turn on the Bias Table for a quick read of where price sits relative to each open, and set up alerts for the levels you watch.
DISCLAIMER
This script is provided for educational and analytical purposes only. It does not constitute financial advice, and past patterns identified by any module do not guarantee future results. Always combine this tool with your own risk management and due diligence.

Feragatname
Bilgiler ve yayınlar, TradingView tarafından sağlanan veya onaylanan finansal, yatırım, alım satım veya diğer türden tavsiye veya öneriler anlamına gelmez ve teşkil etmez. Kullanım Koşulları bölümünde daha fazlasını okuyun.
Feragatname
Bilgiler ve yayınlar, TradingView tarafından sağlanan veya onaylanan finansal, yatırım, alım satım veya diğer türden tavsiye veya öneriler anlamına gelmez ve teşkil etmez. Kullanım Koşulları bölümünde daha fazlasını okuyun.