Anchored TWAP Bands [cryptalent]
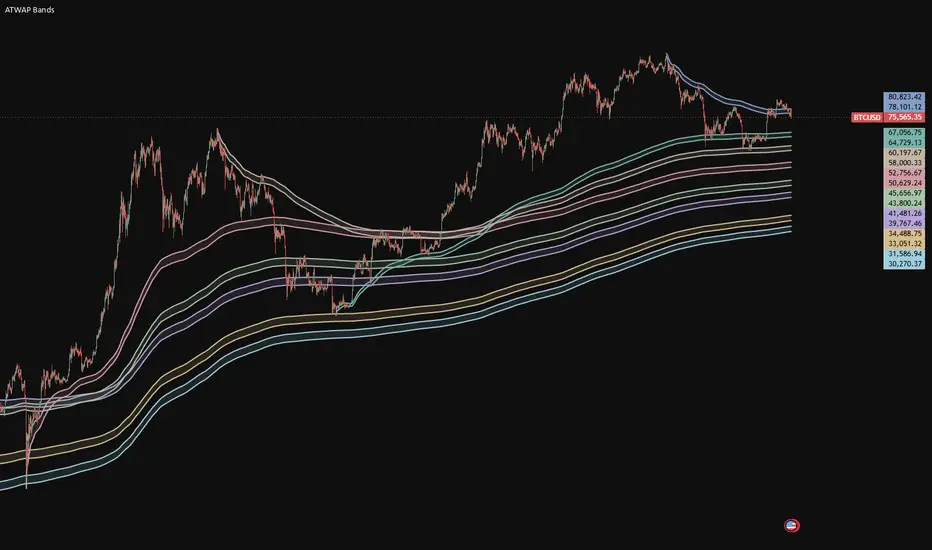
Anchored TWAP Bands displays up to eight independently anchored High/Low average bands. It is designed to compare time-averaged price ranges from different user-selected starting points on one chart.
Getting started
All anchors, A-H, are disabled by default. After adding the indicator, open Settings > Inputs, enable an anchor, and set its date and time within the symbol's loaded history. The chart remains empty until an anchor is enabled and has sufficient data. Replace the editable preset dates with starting points relevant to your analysis.
Calculation
Each enabled anchor produces two boundaries:
Upper boundary = sum of included bar highs / N
Lower boundary = sum of included bar lows / N
N is the number of included chart bars. Both boundaries use the same bars and the same count. Each bar receives equal weight, without volume weighting. Band width therefore equals the average High-Low range of the included bars. The width is not a standard-deviation band or confidence interval, and it does not guarantee that prices will remain inside the band.
The design combines eight manual starting points, synchronized High/Low sampling, and two anchor-alignment choices. This makes it possible to compare several reference periods without adding separate indicator instances. Anchors are selected manually; the script does not automatically identify pivots.
Anchor alignment
Pivot bar, the default, includes the entire candle containing the selected date. On a weekly chart, a date in the middle of a week includes that week's candle. This is a selection of a whole chart bar, including its price movement before the timestamp within that bar.
Next bar open starts with the first candle whose opening time is at or after the selected timestamp. If the timestamp is between trading sessions, both modes begin with the next available candle.
Date and time fields follow the chart's time zone. The retained example timestamps are set to 08:00 UTC+8 and remain editable.
Display controls
Each anchor has its own enable switch, date, boundary color, and line width. Fill bands controls shading between the boundaries. Fill transparency defaults to 88; 0 is opaque and 100 is fully transparent. Both boundary prices are available in the price scale, status line, and Data Window, subject to chart display settings. No price labels are drawn beside the curve endpoints.
Data and interpretation
Calculations use the current chart timeframe. Changing the timeframe changes the sampled highs and lows and can change the bands. Each open bar contributes one developing sample pair, so the current values change as that bar's high and low develop. Input changes, history availability, and source-data revisions can also change calculated values.
The indicator supports standard time-based price charts. Tick charts and non-standard charts such as Heikin Ashi or Renko are not supported. Missing anchor history or missing/invalid High-Low data prevents further valid output for the affected anchor.
Hover explanations and chart status messages use Traditional Chinese. Key status messages mean:
"錨點早於已載入資料": The anchor precedes loaded history. Load older bars or choose a later anchor.
"等待錨定 K 棒": Waiting for the selected anchor bar.
"High/Low 資料缺漏或異常": High/Low data is missing or invalid for that anchor.
The bands are descriptive references for observing price interaction. Manually selecting historical pivots is retrospective analysis. Bands with overlapping reference periods share price data and should not be treated as independent evidence. The script contains no trade entries, automated pivot detection, or alert conditions.
Chart illustration
Any visible bands in the publication chart have been enabled manually for illustration. Every anchor remains disabled in the source-code defaults; users choose which anchors to enable.
Getting started
All anchors, A-H, are disabled by default. After adding the indicator, open Settings > Inputs, enable an anchor, and set its date and time within the symbol's loaded history. The chart remains empty until an anchor is enabled and has sufficient data. Replace the editable preset dates with starting points relevant to your analysis.
Calculation
Each enabled anchor produces two boundaries:
Upper boundary = sum of included bar highs / N
Lower boundary = sum of included bar lows / N
N is the number of included chart bars. Both boundaries use the same bars and the same count. Each bar receives equal weight, without volume weighting. Band width therefore equals the average High-Low range of the included bars. The width is not a standard-deviation band or confidence interval, and it does not guarantee that prices will remain inside the band.
The design combines eight manual starting points, synchronized High/Low sampling, and two anchor-alignment choices. This makes it possible to compare several reference periods without adding separate indicator instances. Anchors are selected manually; the script does not automatically identify pivots.
Anchor alignment
Pivot bar, the default, includes the entire candle containing the selected date. On a weekly chart, a date in the middle of a week includes that week's candle. This is a selection of a whole chart bar, including its price movement before the timestamp within that bar.
Next bar open starts with the first candle whose opening time is at or after the selected timestamp. If the timestamp is between trading sessions, both modes begin with the next available candle.
Date and time fields follow the chart's time zone. The retained example timestamps are set to 08:00 UTC+8 and remain editable.
Display controls
Each anchor has its own enable switch, date, boundary color, and line width. Fill bands controls shading between the boundaries. Fill transparency defaults to 88; 0 is opaque and 100 is fully transparent. Both boundary prices are available in the price scale, status line, and Data Window, subject to chart display settings. No price labels are drawn beside the curve endpoints.
Data and interpretation
Calculations use the current chart timeframe. Changing the timeframe changes the sampled highs and lows and can change the bands. Each open bar contributes one developing sample pair, so the current values change as that bar's high and low develop. Input changes, history availability, and source-data revisions can also change calculated values.
The indicator supports standard time-based price charts. Tick charts and non-standard charts such as Heikin Ashi or Renko are not supported. Missing anchor history or missing/invalid High-Low data prevents further valid output for the affected anchor.
Hover explanations and chart status messages use Traditional Chinese. Key status messages mean:
"錨點早於已載入資料": The anchor precedes loaded history. Load older bars or choose a later anchor.
"等待錨定 K 棒": Waiting for the selected anchor bar.
"High/Low 資料缺漏或異常": High/Low data is missing or invalid for that anchor.
The bands are descriptive references for observing price interaction. Manually selecting historical pivots is retrospective analysis. Bands with overlapping reference periods share price data and should not be treated as independent evidence. The script contains no trade entries, automated pivot detection, or alert conditions.
Chart illustration
Any visible bands in the publication chart have been enabled manually for illustration. Every anchor remains disabled in the source-code defaults; users choose which anchors to enable.

Feragatname
Bilgiler ve yayınlar, TradingView tarafından sağlanan veya onaylanan finansal, yatırım, alım satım veya diğer türden tavsiye veya öneriler anlamına gelmez ve teşkil etmez. Kullanım Koşulları bölümünde daha fazlasını okuyun.
Feragatname
Bilgiler ve yayınlar, TradingView tarafından sağlanan veya onaylanan finansal, yatırım, alım satım veya diğer türden tavsiye veya öneriler anlamına gelmez ve teşkil etmez. Kullanım Koşulları bölümünde daha fazlasını okuyun.