OPEN-SOURCE SCRIPT
Güncellendi Volume Strata Profile
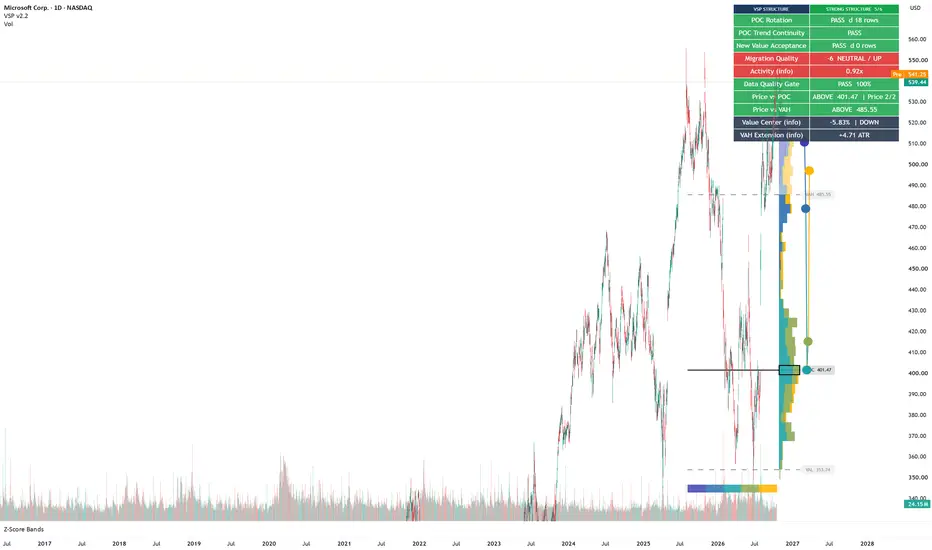
Volume Strata Profile (VSP) is a volume-at-price analysis tool designed to add a chronological dimension to the traditional Volume Profile.
A conventional Volume Profile shows where trading activity accumulated across price, but it does not clearly show when that volume was built. VSP addresses this by dividing the selected lookback period into chronological time strata and displaying each stratum inside the same price-row profile.
This makes it possible to distinguish older accepted-value areas from newer ones, track how the Point of Control changes through time, identify historical high-volume areas that are no longer receiving meaningful recent participation, and evaluate whether value is migrating higher, lower, or remaining relatively balanced.
Core Concept
The selected lookback is divided into multiple chronological strata.
The default color progression is:
- Indigo: oldest activity
- Teal: intermediate activity
- Amber: newest activity
Within each price row, volume from the individual strata is stacked horizontally. The result shows both:
- where estimated volume accumulated, and
- when that volume entered the profile.
This chronological structure is the primary difference between VSP and a conventional single-layer Volume Profile.
Intrabar Volume Engine
VSP uses lower-timeframe OHLCV data through Pine Script's intrabar functionality whenever it is available.
Instead of assigning the entire volume of a chart bar across that bar's complete High-Low range, the indicator decomposes the chart bar into available lower-timeframe bars and processes their smaller price ranges individually.
For example, on a Daily chart the adaptive engine may use 5-minute data when the available intrabar budget permits it.
The automatic resolution engine selects the finest practical lower timeframe while respecting the available intrabar-data budget.
Users can also manually choose the lower timeframe.
TradingView's own Volume Profile methodology also uses lower-timeframe information to improve price-level resolution. VSP uses its own custom intrabar allocation and chronological-strata model. TradingView
Adaptive Intrabar Resolution
When Intrabar Timeframe is set to Auto, VSP evaluates the chart timeframe, lookback length, and requested intrabar budget.
The High precision mode prioritizes the finest practical intrabar resolution within a maximum 100,000-bar request budget.
Balanced mode uses a smaller approximate budget to reduce processing requirements.
The indicator also measures the quality of the retrieved intrabar dataset using:
- Intrabar coverage
- Average intrabars per covered chart bar
- Maximum observed intrabars per chart bar
- Density adequacy
- Fallback chart-bar count
These metrics are used internally to prevent poor intrabar coverage from producing unjustifiably high confidence readings.
TradingView limits the amount of lower-timeframe history available to scripts depending on the user's plan. TradingView
Composite POC and Value Area
VSP calculates a Composite Point of Control (POC), Value Area High (VAH), and Value Area Low (VAL).
POC represents the price row containing the greatest estimated volume across the complete analysis window.
The Value Area is constructed outward from the POC until the selected percentage of total profile volume is included. The default setting is 70%.
TradingView also commonly defines the Value Area as the region containing the selected percentage of profile volume, with 70% being a commonly used default. TradingView
Value Migration Spine
The colored points displayed to the right of the profile represent the POC of each chronological stratum.
The points are connected from oldest to newest, producing the Value Migration Spine.
This allows the user to visually inspect how the market's estimated accepted-value concentration moved through time.
An upward migration indicates that later strata developed their highest-volume concentrations at progressively higher prices.
A downward migration indicates the opposite.
This should not be interpreted as a prediction of future price direction.
It describes the historical migration of estimated value.
Developing POC
For each chronological layer, VSP also calculates a cumulative Developing POC.
The Developing POC represents the strongest cumulative volume row after adding each successive stratum.
It is available in the migration-point tooltips and provides a second view of how the broader profile developed.
Recent Acceptance POC
VSP independently calculates a Recent Acceptance POC from the most recent portion of the selected lookback.
This is compared with the newest stratum POC.
When both methods identify approximately the same price region, the indicator considers the most recent value concentration more internally consistent.
Value Migration Efficiency
Migration Efficiency measures how directly the stratum POCs moved from the oldest value location to the newest one.
A high reading means that most of the total POC movement occurred in a relatively consistent direction.
A low reading means the POCs moved back and forth considerably before reaching their latest location.
Migration Efficiency measures path consistency. It does not measure the probability of future price movement.
Activity Support
VSP compares average volume per chart bar in the newest stratum with average volume per chart bar across the complete profile.
The raw activity ratio remains visible in the tooltip.
A bounded normalization is then used internally so unusually large volume readings cannot increase confidence without limit.
Participation Balance
VSP compares the total volume of the newest stratum with the previous stratum.
Unlike a simple "higher volume is better" rule, the Participation Balance calculation measures comparability.
A ratio near 1.0 means the two strata contain reasonably comparable total participation.
Very large differences between adjacent strata reduce comparability because they may represent different liquidity, session, or volume regimes.
For example, an extreme newest-to-previous volume ratio is not treated as perfect confirmation simply because the newer period contains substantially more volume.
Value Migration Confidence
Value Migration Confidence measures the internal reliability of the detected value migration.
It combines:
- Migration Efficiency
- Newest-layer Activity Support
- Participation Balance
- Recent Acceptance alignment
- Intrabar data quality
Poor intrabar quality imposes a confidence ceiling.
This value is specifically a confidence score for the observed value-migration structure.
It is not a probability that price will rise or fall.
Value Stability
Value Stability measures how dispersed the stratum POCs are relative to the complete profile range.
High stability means value remained concentrated within a relatively narrow region.
Low stability means value locations moved substantially throughout the analysis window.
Low stability can coexist with high Migration Efficiency. In that case, value moved significantly, but did so in a relatively orderly direction.
Stale High Volume Nodes
VSP includes an adaptive Stale HVN engine.
A Stale High Volume Node is a historically important high-volume region that currently receives relatively little recent volume participation.
The engine evaluates:
- Historical row-volume strength
- Adaptive profile-relative HVN thresholds
- Recent volume share
- Nearby-row clustering
- Optional ATR-normalized distance from current price
Adjacent qualifying rows are grouped into logical clusters to avoid multiple redundant stale-HVN lines representing essentially the same historical value area.
When several stale clusters exist, the strongest candidates are prioritized.
Time Ribbon
The colored ribbon beneath the analyzed price range shows the chronological boundaries of the selected strata.
Its colors correspond directly to the colors used inside the profile and provide a visual reference for identifying which historical bars belong to each layer.
Inputs
Lookback bars
Controls the number of chart bars included in the analysis.
Price rows
Controls the vertical price resolution of the profile.
Time strata
Controls the number of chronological layers.
Value area %
Controls the percentage of total estimated volume included in the Value Area.
Use intrabar volume
Enables lower-timeframe volume analysis.
Intrabar timeframe
Selects Auto or a manual lower timeframe.
Auto precision
Controls how aggressively the automatic engine uses the intrabar-data budget.
Profile width / gap / transparency
Visual settings only. They do not modify the underlying calculations.
Adaptive HVN detection
Enables profile-relative statistical HVN filtering.
Recent window
Defines the recent portion of the lookback used for Stale HVNs and Recent Acceptance POC.
Cluster gap tolerance
Controls how nearby stale rows are grouped.
Stale distance filter
Optionally removes stale nodes located beyond the selected ATR-normalized distance.
How to Use VSP
VSP is designed as a contextual volume-analysis tool rather than an entry/exit signal generator.
Useful observations include:
- Whether newer value is migrating above or below older value
- Whether current price is trading far from accepted value
- Whether recent activity confirms the newest stratum POC
- Whether the migration path is orderly or unstable
- Whether historically important high-volume areas have become inactive
- Whether price and accepted value are moving together or separating
A strong Value Migration Confidence reading means the value-migration structure is internally consistent.
It does not mean that future price direction is known with the same probability.
Originality
The distinguishing feature of VSP is the integration of chronological time strata directly inside a volume-at-price profile.
Rather than presenting volume as one aggregated distribution, the script retains the chronological origin of the estimated volume assigned to each price row.
The indicator then builds additional analysis around this structure, including:
- Stratum-specific POCs
- Value Migration Spine
- Developing POC
- Recent Acceptance POC
- Migration Efficiency
- Value Stability
- Adaptive Intrabar Quality
- Participation Balance
- Adaptive Stale HVN clustering
These components are designed specifically to analyze how accepted value changes through time rather than simply where aggregate volume accumulated.
Limitations
VSP does not have access to transaction-by-transaction Volume-at-Price.
Even when lower-timeframe data is used, each intrabar's volume must still be estimated across the price rows overlapped by that intrabar's High-Low range.
For this reason, the profile should not be interpreted as exchange-level order-flow data.
Lower-timeframe data availability depends on the symbol, market, TradingView data feed, and account plan.
Where lower-timeframe data is unavailable, the script can fall back to chart-bar OHLCV processing.
The active chart bar and its intrabars can change while they are forming.
Historical and realtime lower-timeframe feeds can also differ after a script reload because data providers may revise realtime data. TradingView explicitly notes that lower-timeframe requests are not immune to repainting behavior on realtime data. TradingView
Repainting and Realtime Behavior
The script does not intentionally use future data.
Historical calculations are based on available historical chart and intrabar data.
However, the active realtime bar is not final. Its High, Low, and Volume values, as well as the lower-timeframe bars contained within it, can change until they close.
Consequently, the current profile, newest stratum POC, Recent Acceptance POC, stale-node status, and migration metrics can update during the active bar.
Lower-timeframe data may also differ after a reload if TradingView's data provider revises previously realtime information.
Important
VSP is an analytical visualization tool.
It does not predict future prices, provide guaranteed trading signals, or guarantee profitable outcomes.
Volume Profile analysis is primarily reactive: it describes where trading activity occurred and how accepted value developed historically. TradingView similarly characterizes Volume Profile as primarily showing historical trading activity rather than forecasting future movement. TradingView
Use the indicator together with independent market analysis and appropriate risk management.
A conventional Volume Profile shows where trading activity accumulated across price, but it does not clearly show when that volume was built. VSP addresses this by dividing the selected lookback period into chronological time strata and displaying each stratum inside the same price-row profile.
This makes it possible to distinguish older accepted-value areas from newer ones, track how the Point of Control changes through time, identify historical high-volume areas that are no longer receiving meaningful recent participation, and evaluate whether value is migrating higher, lower, or remaining relatively balanced.
Core Concept
The selected lookback is divided into multiple chronological strata.
The default color progression is:
- Indigo: oldest activity
- Teal: intermediate activity
- Amber: newest activity
Within each price row, volume from the individual strata is stacked horizontally. The result shows both:
- where estimated volume accumulated, and
- when that volume entered the profile.
This chronological structure is the primary difference between VSP and a conventional single-layer Volume Profile.
Intrabar Volume Engine
VSP uses lower-timeframe OHLCV data through Pine Script's intrabar functionality whenever it is available.
Instead of assigning the entire volume of a chart bar across that bar's complete High-Low range, the indicator decomposes the chart bar into available lower-timeframe bars and processes their smaller price ranges individually.
For example, on a Daily chart the adaptive engine may use 5-minute data when the available intrabar budget permits it.
The automatic resolution engine selects the finest practical lower timeframe while respecting the available intrabar-data budget.
Users can also manually choose the lower timeframe.
TradingView's own Volume Profile methodology also uses lower-timeframe information to improve price-level resolution. VSP uses its own custom intrabar allocation and chronological-strata model. TradingView
Adaptive Intrabar Resolution
When Intrabar Timeframe is set to Auto, VSP evaluates the chart timeframe, lookback length, and requested intrabar budget.
The High precision mode prioritizes the finest practical intrabar resolution within a maximum 100,000-bar request budget.
Balanced mode uses a smaller approximate budget to reduce processing requirements.
The indicator also measures the quality of the retrieved intrabar dataset using:
- Intrabar coverage
- Average intrabars per covered chart bar
- Maximum observed intrabars per chart bar
- Density adequacy
- Fallback chart-bar count
These metrics are used internally to prevent poor intrabar coverage from producing unjustifiably high confidence readings.
TradingView limits the amount of lower-timeframe history available to scripts depending on the user's plan. TradingView
Composite POC and Value Area
VSP calculates a Composite Point of Control (POC), Value Area High (VAH), and Value Area Low (VAL).
POC represents the price row containing the greatest estimated volume across the complete analysis window.
The Value Area is constructed outward from the POC until the selected percentage of total profile volume is included. The default setting is 70%.
TradingView also commonly defines the Value Area as the region containing the selected percentage of profile volume, with 70% being a commonly used default. TradingView
Value Migration Spine
The colored points displayed to the right of the profile represent the POC of each chronological stratum.
The points are connected from oldest to newest, producing the Value Migration Spine.
This allows the user to visually inspect how the market's estimated accepted-value concentration moved through time.
An upward migration indicates that later strata developed their highest-volume concentrations at progressively higher prices.
A downward migration indicates the opposite.
This should not be interpreted as a prediction of future price direction.
It describes the historical migration of estimated value.
Developing POC
For each chronological layer, VSP also calculates a cumulative Developing POC.
The Developing POC represents the strongest cumulative volume row after adding each successive stratum.
It is available in the migration-point tooltips and provides a second view of how the broader profile developed.
Recent Acceptance POC
VSP independently calculates a Recent Acceptance POC from the most recent portion of the selected lookback.
This is compared with the newest stratum POC.
When both methods identify approximately the same price region, the indicator considers the most recent value concentration more internally consistent.
Value Migration Efficiency
Migration Efficiency measures how directly the stratum POCs moved from the oldest value location to the newest one.
A high reading means that most of the total POC movement occurred in a relatively consistent direction.
A low reading means the POCs moved back and forth considerably before reaching their latest location.
Migration Efficiency measures path consistency. It does not measure the probability of future price movement.
Activity Support
VSP compares average volume per chart bar in the newest stratum with average volume per chart bar across the complete profile.
The raw activity ratio remains visible in the tooltip.
A bounded normalization is then used internally so unusually large volume readings cannot increase confidence without limit.
Participation Balance
VSP compares the total volume of the newest stratum with the previous stratum.
Unlike a simple "higher volume is better" rule, the Participation Balance calculation measures comparability.
A ratio near 1.0 means the two strata contain reasonably comparable total participation.
Very large differences between adjacent strata reduce comparability because they may represent different liquidity, session, or volume regimes.
For example, an extreme newest-to-previous volume ratio is not treated as perfect confirmation simply because the newer period contains substantially more volume.
Value Migration Confidence
Value Migration Confidence measures the internal reliability of the detected value migration.
It combines:
- Migration Efficiency
- Newest-layer Activity Support
- Participation Balance
- Recent Acceptance alignment
- Intrabar data quality
Poor intrabar quality imposes a confidence ceiling.
This value is specifically a confidence score for the observed value-migration structure.
It is not a probability that price will rise or fall.
Value Stability
Value Stability measures how dispersed the stratum POCs are relative to the complete profile range.
High stability means value remained concentrated within a relatively narrow region.
Low stability means value locations moved substantially throughout the analysis window.
Low stability can coexist with high Migration Efficiency. In that case, value moved significantly, but did so in a relatively orderly direction.
Stale High Volume Nodes
VSP includes an adaptive Stale HVN engine.
A Stale High Volume Node is a historically important high-volume region that currently receives relatively little recent volume participation.
The engine evaluates:
- Historical row-volume strength
- Adaptive profile-relative HVN thresholds
- Recent volume share
- Nearby-row clustering
- Optional ATR-normalized distance from current price
Adjacent qualifying rows are grouped into logical clusters to avoid multiple redundant stale-HVN lines representing essentially the same historical value area.
When several stale clusters exist, the strongest candidates are prioritized.
Time Ribbon
The colored ribbon beneath the analyzed price range shows the chronological boundaries of the selected strata.
Its colors correspond directly to the colors used inside the profile and provide a visual reference for identifying which historical bars belong to each layer.
Inputs
Lookback bars
Controls the number of chart bars included in the analysis.
Price rows
Controls the vertical price resolution of the profile.
Time strata
Controls the number of chronological layers.
Value area %
Controls the percentage of total estimated volume included in the Value Area.
Use intrabar volume
Enables lower-timeframe volume analysis.
Intrabar timeframe
Selects Auto or a manual lower timeframe.
Auto precision
Controls how aggressively the automatic engine uses the intrabar-data budget.
Profile width / gap / transparency
Visual settings only. They do not modify the underlying calculations.
Adaptive HVN detection
Enables profile-relative statistical HVN filtering.
Recent window
Defines the recent portion of the lookback used for Stale HVNs and Recent Acceptance POC.
Cluster gap tolerance
Controls how nearby stale rows are grouped.
Stale distance filter
Optionally removes stale nodes located beyond the selected ATR-normalized distance.
How to Use VSP
VSP is designed as a contextual volume-analysis tool rather than an entry/exit signal generator.
Useful observations include:
- Whether newer value is migrating above or below older value
- Whether current price is trading far from accepted value
- Whether recent activity confirms the newest stratum POC
- Whether the migration path is orderly or unstable
- Whether historically important high-volume areas have become inactive
- Whether price and accepted value are moving together or separating
A strong Value Migration Confidence reading means the value-migration structure is internally consistent.
It does not mean that future price direction is known with the same probability.
Originality
The distinguishing feature of VSP is the integration of chronological time strata directly inside a volume-at-price profile.
Rather than presenting volume as one aggregated distribution, the script retains the chronological origin of the estimated volume assigned to each price row.
The indicator then builds additional analysis around this structure, including:
- Stratum-specific POCs
- Value Migration Spine
- Developing POC
- Recent Acceptance POC
- Migration Efficiency
- Value Stability
- Adaptive Intrabar Quality
- Participation Balance
- Adaptive Stale HVN clustering
These components are designed specifically to analyze how accepted value changes through time rather than simply where aggregate volume accumulated.
Limitations
VSP does not have access to transaction-by-transaction Volume-at-Price.
Even when lower-timeframe data is used, each intrabar's volume must still be estimated across the price rows overlapped by that intrabar's High-Low range.
For this reason, the profile should not be interpreted as exchange-level order-flow data.
Lower-timeframe data availability depends on the symbol, market, TradingView data feed, and account plan.
Where lower-timeframe data is unavailable, the script can fall back to chart-bar OHLCV processing.
The active chart bar and its intrabars can change while they are forming.
Historical and realtime lower-timeframe feeds can also differ after a script reload because data providers may revise realtime data. TradingView explicitly notes that lower-timeframe requests are not immune to repainting behavior on realtime data. TradingView
Repainting and Realtime Behavior
The script does not intentionally use future data.
Historical calculations are based on available historical chart and intrabar data.
However, the active realtime bar is not final. Its High, Low, and Volume values, as well as the lower-timeframe bars contained within it, can change until they close.
Consequently, the current profile, newest stratum POC, Recent Acceptance POC, stale-node status, and migration metrics can update during the active bar.
Lower-timeframe data may also differ after a reload if TradingView's data provider revises previously realtime information.
Important
VSP is an analytical visualization tool.
It does not predict future prices, provide guaranteed trading signals, or guarantee profitable outcomes.
Volume Profile analysis is primarily reactive: it describes where trading activity occurred and how accepted value developed historically. TradingView similarly characterizes Volume Profile as primarily showing historical trading activity rather than forecasting future movement. TradingView
Use the indicator together with independent market analysis and appropriate risk management.
Sürüm Notları
• Improved the visibility of the main Volume Profile levels. POC now uses a stronger solid line and larger label, while VAH and VAL use clearer dashed lines and larger labels for easier chart reading.• Added adjustable line-width controls for POC and VAH/VAL under Key Level Appearance.
• Refined Stale HVN filtering to reduce unnecessary historical clutter. The default maximum number of displayed stale nodes has been reduced to one.
• Tightened the default Stale HVN distance filter from 8 ATR to 5 ATR so only historically significant nodes that remain reasonably relevant to current price are displayed.
• Stale HVN ranking continues to consider historical volume strength, lack of recent participation, clustering, and proximity to current price.
• These changes affect only the visualization and relevance filtering of Stale HVNs. They do not alter the core Volume Profile, POC/VAH/VAL calculations, Value Migration Spine, Recent Acceptance logic, Intrabar Volume Engine, confidence model, or screening dashboard.
• The Screening Dashboard remains optional and continues to evaluate Latest POC direction, Recent Alignment, Activity Support, Participation Balance, Intrabar Quality, Price vs POC, Price vs VAH, and Value Migration Confidence.
Sürüm Notları
• Added Pine Screener compatibility without changing the indicator’s core calculations or chart visuals.• Added four hidden screening outputs for use inside Pine Screener:
- VSP Score (0–7)
- Latest POC Up
- Recent Alignment %
- Migration Confidence %
• Added two screening conditions:
- Early Value Rotation
- Confirmed Value Expansion
• Early Value Rotation is designed to identify symbols where value has started rotating upward while price is above POC but has not yet fully confirmed above VAH.
• Confirmed Value Expansion identifies symbols where the upward value shift is supported by the core VSP conditions and price has confirmed above VAH.
• VSP Score uses the same seven conditions already evaluated by the on-chart Screening Dashboard:
Latest POC direction, Recent Alignment, Activity Support, Participation Balance, Intrabar Quality, Price vs POC, and Price vs VAH.
• The new screener outputs are hidden from the chart and do not affect the Volume Profile, POC/VAH/VAL, Value Migration Spine, Intrabar Volume Engine, Stale HVN logic, dashboard, or confidence calculations.
• This update allows VSP to be used both as a chart-analysis tool and as a Pine Screener discovery tool for finding potential early value-rotation and confirmed value-expansion setups.
Sürüm Notları
• Refined the Early Value Rotation condition used in Pine Screener to better identify developing value rotations before full price confirmation.• The previous Early Value Rotation filter was intentionally conservative and could produce very limited screener results because several high-threshold confirmation conditions had to be satisfied simultaneously.
• Early Value Rotation now focuses on the most relevant early-stage conditions:
- Latest POC is higher than the previous POC.
- Recent Alignment is at least 70%.
- Price is above POC.
- Participation Balance is at least 40%.
- Intrabar Quality is at least 70%.
- Price remains below VAH, indicating that full value-area breakout confirmation has not yet occurred.
• Confirmed Value Expansion remains unchanged and continues to represent the stricter confirmation stage.
• This update only changes the Pine Screener Early Value Rotation condition. It does not modify the core Volume Profile calculations, POC/VAH/VAL, Value Migration Spine, Intrabar Volume Engine, Stale HVN logic, Screening Dashboard, VSP Score, or Migration Confidence model.
Sürüm Notları
• Refined the Early Value Rotation condition for Pine Screener to improve early-stage opportunity detection.• The previous version remained too restrictive when combined with VSP Score filtering, resulting in very limited screener matches.
• Early Value Rotation now focuses on four core conditions:
- Latest POC is higher than the previous POC.
- Price is above POC.
- Recent Alignment is at least 60%.
- Intrabar Quality is at least 70%.
• Removed the mandatory Participation Balance threshold from the Early Value Rotation condition.
• Removed the requirement for price to remain below VAH, allowing the screener to capture both pre-breakout and newly confirmed value-rotation candidates.
• Confirmed Value Expansion remains unchanged and continues to represent the stricter confirmation stage.
• No changes were made to the core Volume Profile engine, POC/VAH/VAL calculations, Value Migration Spine, Intrabar Volume Engine, Stale HVN logic, Screening Dashboard, VSP Score, or Migration Confidence model.
Sürüm Notları
• Refined the Pine Screener Early Value Rotation condition to improve early-stage opportunity detection.• Early Value Rotation now focuses on three core conditions:
- Latest POC is higher than the previous POC.
- Price is above POC.
- Recent Alignment is at least 60%.
• Removed the Intrabar Quality requirement from the Early Value Rotation filter to prevent the early-stage screener condition from becoming unnecessarily restrictive.
• Intrabar Quality remains fully integrated in the core VSP calculations, Screening Dashboard, VSP Score, and Migration Confidence model.
• Confirmed Value Expansion remains unchanged and continues to represent the stricter confirmation stage.
• No changes were made to the core Volume Profile engine, POC/VAH/VAL calculations, Value Migration Spine, Stale HVN logic, Screening Dashboard, or Migration Confidence calculations.
Sürüm Notları
• Refined the Pine Screener Early Value Rotation condition after validating each screening component independently.• Early Value Rotation now focuses specifically on the beginning of upward value migration:
- Latest POC is higher than the previous POC.
- Recent Alignment is at least 60%.
• Removed the mandatory Price Above POC requirement from Early Value Rotation. This allows VSP to identify value rotation before price confirmation rather than requiring confirmation at the discovery stage.
• Price confirmation remains represented by the VSP Score and the stricter Confirmed Value Expansion condition.
• No changes were made to the core Volume Profile engine, POC/VAH/VAL calculations, Value Migration Spine, Intrabar Volume Engine, Stale HVN logic, Screening Dashboard, VSP Score, or Migration Confidence model.
Sürüm Notları
• Improved Pine Screener compatibility for the VSP setup states.• Early Value Rotation and Confirmed Value Expansion are now exported as hidden numeric outputs (0/1) instead of alert-condition filters.
• This makes both setup states behave consistently with the already validated VSP Score and Latest POC Up screener outputs.
• 1 indicates that the setup condition is currently satisfied, while 0 indicates that it is not.
• The underlying Early Value Rotation and Confirmed Value Expansion logic remains unchanged.
• No changes were made to the core Volume Profile engine, POC/VAH/VAL calculations, Value Migration Spine, Intrabar Volume Engine, Screening Dashboard, Stale HVN logic, VSP Score, or Migration Confidence model.
Sürüm Notları
Volume Strata Profile v2 – Major UpdateVersion 2 introduces a substantial refinement of VSP’s structural analysis, screening logic, data-quality handling, and chart presentation while preserving the original time-layered Volume Profile concept.
What’s New
• VSP Scoring Model 2.2
The previous screening model has been redesigned to separate market structure from data reliability. The Structure Score now describes the current value and momentum context rather than acting as a trade-probability score.
• New Value Acceptance
The previous alignment logic has been replaced with a non-overlapping acceptance test inside the newest time stratum. This helps evaluate whether newly established value is being maintained rather than comparing the latest POC with an overlapping historical window.
• Improved POC Rotation and Persistence
POC movement now includes tolerance for small row-to-row changes, reducing sensitivity to insignificant shifts. Persistence also evaluates whether upward value migration is sustained rather than simply repeating the latest POC direction.
• Directional Migration Quality
Migration Quality now reflects both the efficiency and direction of value migration. It is expressed as a structural score rather than a probability or confidence percentage.
• Recent Migration State
VSP now distinguishes the most recent value behavior from the full-lookback migration structure, including states such as:
- UP
- DOWN
- UP START
- DOWN START
- TURNING UP
- TURNING DOWN
- FLAT / MIXED
This helps identify situations where the long-term profile remains positive while recent value has started to weaken.
• Data Quality Gate
Intrabar data quality is no longer counted as a bullish scoring point. It is now used as a reliability gate. When lower-timeframe data is unavailable or inappropriate, VSP can operate in Chart Bar mode rather than automatically treating the reading as invalid.
• Recent-Data Quality Evaluation
Intrabar quality assessment is focused on the recent strata used by the structural model, reducing unnecessary penalties caused by missing lower-timeframe history in older sections of the profile.
• Activity Expansion
Recent volume activity is evaluated directly relative to average profile activity instead of using the previous participation-balance model.
• Pine Screener Support
VSP now provides dedicated hidden outputs for TradingView Pine Screener, including:
- VSP Structure Score
- Latest POC Up
- New Value Acceptance
- Migration Quality
- Early Value Rotation
- Confirmed Value Expansion
These outputs are designed for symbol filtering and ranking, not as standalone buy or sell signals.
• Early Value Rotation
Represents an early structural state in which value is beginning to rotate upward.
• Confirmed Value Expansion
Represents a stricter structural state requiring stronger value migration, acceptance, activity, and price confirmation.
• Stale HVN Refinements
Historical High Volume Nodes are filtered more selectively to reduce chart clutter and emphasize the most relevant nearby historical acceptance areas.
• Improved Key-Level Visibility
POC, VAH, and VAL presentation has been refined for clearer visual identification.
Important Usage Note
VSP is a value-migration, volume-structure, and momentum-context analysis tool.
The Structure Score, Early Value Rotation, and Confirmed Value Expansion describe the current market structure. They should not be interpreted as calibrated probabilities, guaranteed signals, or standalone trade recommendations.
Preliminary testing showed that VSP is more useful as a structural and momentum-context filter than as a complete entry-and-exit system. Its behavior may also vary between trending/high-beta instruments and defensive or strongly mean-reverting markets.
Users should combine VSP with independent analysis and appropriate risk management.
Core Concept Remains Unchanged
The original VSP architecture remains intact:
- Time-layered Volume Profile
- POC / VAH / VAL
- Value Migration Spine
- Strata Time Ribbon
- Intrabar Volume Distribution
- Stale HVN analysis
Version 2 primarily improves how these structural components are interpreted, scored, and exposed to the Pine Screener.
Sürüm Notları
Update – Pine Screener Refinement• Renamed Latest POC Up to POC Rotation for consistency between the dashboard and Pine Screener.
• Improved Pine Screener compatibility by removing the Data Quality Gate from blocking screener results.
• Data Quality remains visible in the dashboard as a reliability warning, while screener outputs continue to work using the available chart-bar/intrabar data.
• No changes were made to the core VSP calculations, Volume Profile, POC/VAH/VAL, Migration Quality, New Value Acceptance, or scoring logic.
Sürüm Notları
**Volume Strata Profile v2.2 — Latest Update**This update improves the indicator's analytical capabilities while preserving its original volume profile visualization and six-point structural scoring model.
**Key improvements:**
- Added **Value Center Migration** to track shifts in the estimated volume-weighted price center across time strata.
- Added **VAH Extension (ATR)** to measure how far the current price is from the upper Value Area boundary.
- Improved POC rotation, trend continuity, and new-value acceptance assessments.
- Refined migration classification, including the UP PAUSE state.
- Improved intrabar data-quality reporting and dashboard clarity.
- Removed Pine Screener functionality to simplify the indicator and reduce computational overhead.
Both new analytical metrics are informational and do not affect the existing 6-point structure score.
**VSP is designed for volume structure and value migration analysis, not price prediction or buy/sell signals.**
Açık kaynak kodlu komut dosyası
Gerçek TradingView ruhuyla, bu komut dosyasının mimarı, yatırımcıların işlevselliğini inceleyip doğrulayabilmesi için onu açık kaynaklı hale getirdi. Yazarı tebrik ederiz! Ücretsiz olarak kullanabilseniz de, kodu yeniden yayınlamanın Topluluk Kurallarımıza tabi olduğunu unutmayın.

Feragatname
Bilgiler ve yayınlar, TradingView tarafından sağlanan veya onaylanan finansal, yatırım, alım satım veya diğer türden tavsiye veya öneriler anlamına gelmez ve teşkil etmez. Kullanım Koşulları bölümünde daha fazlasını okuyun.
Açık kaynak kodlu komut dosyası
Gerçek TradingView ruhuyla, bu komut dosyasının mimarı, yatırımcıların işlevselliğini inceleyip doğrulayabilmesi için onu açık kaynaklı hale getirdi. Yazarı tebrik ederiz! Ücretsiz olarak kullanabilseniz de, kodu yeniden yayınlamanın Topluluk Kurallarımıza tabi olduğunu unutmayın.
Feragatname
Bilgiler ve yayınlar, TradingView tarafından sağlanan veya onaylanan finansal, yatırım, alım satım veya diğer türden tavsiye veya öneriler anlamına gelmez ve teşkil etmez. Kullanım Koşulları bölümünde daha fazlasını okuyun.