OPEN-SOURCE SCRIPT
Güncellendi Gap Fill Probability for SPY SPX XSP
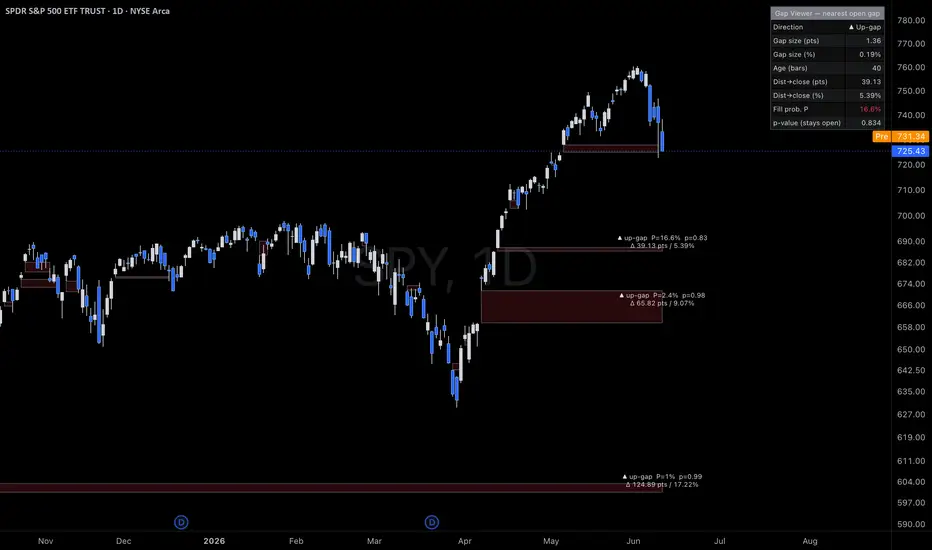
Gap Fill Probability Viewer - open gaps with an adaptive fill probability
Gap Fill Probability Viewer automatically finds price gaps on your chart and draws each one as a colored zone - no more drawing rectangles by hand. It then tells you how likely each open gap is to "fill," and exactly how far price has to travel to close it.
What it shows
How the probability works
The estimate adapts to three things research associates with gap fills:
- Size - bigger gaps are harder to fill.
- Distance - the closer price is to the gap, the higher the odds.
- Recency - fresh gaps fill faster; old, stubborn gaps lose momentum.
Handy options
- Auto-hide, fade, or keep gaps once they fill.
- Filter out tiny gaps by % or ATR.
- Detect gaps on wicks or candle bodies.
- Fully tunable probability model and colors.
⚠️ The fill probability is a heuristic estimate for study and education — not a guarantee or financial advice. Calibrate the settings to your own market and timeframe.
Gap Fill Probability Viewer automatically finds price gaps on your chart and draws each one as a colored zone - no more drawing rectangles by hand. It then tells you how likely each open gap is to "fill," and exactly how far price has to travel to close it.
What it shows
- Gap zones - every gap-up and gap-down, drawn as a box that extends to the current bar.
- Fill probability (P) - an estimate of how likely the gap is to close, shown as a % and color-coded (green = likely, orange = uncertain, red = unlikely).
- p-value - the flip side of P: the chance the gap stays open.
- Distance to close - how far the current price is from fully closing the gap, in both points and % of the charted symbol.
- Stats table - a clean summary for the gap closest to filling.
How the probability works
The estimate adapts to three things research associates with gap fills:
- Size - bigger gaps are harder to fill.
- Distance - the closer price is to the gap, the higher the odds.
- Recency - fresh gaps fill faster; old, stubborn gaps lose momentum.
Handy options
- Auto-hide, fade, or keep gaps once they fill.
- Filter out tiny gaps by % or ATR.
- Detect gaps on wicks or candle bodies.
- Fully tunable probability model and colors.
⚠️ The fill probability is a heuristic estimate for study and education — not a guarantee or financial advice. Calibrate the settings to your own market and timeframe.
Sürüm Notları
Renamed, Chart updatedAçık kaynak kodlu komut dosyası
Gerçek TradingView ruhuyla, bu komut dosyasının mimarı, yatırımcıların işlevselliğini inceleyip doğrulayabilmesi için onu açık kaynaklı hale getirdi. Yazarı tebrik ederiz! Ücretsiz olarak kullanabilseniz de, kodu yeniden yayınlamanın Topluluk Kurallarımıza tabi olduğunu unutmayın.

Feragatname
Bilgiler ve yayınlar, TradingView tarafından sağlanan veya onaylanan finansal, yatırım, alım satım veya diğer türden tavsiye veya öneriler anlamına gelmez ve teşkil etmez. Kullanım Koşulları bölümünde daha fazlasını okuyun.
Açık kaynak kodlu komut dosyası
Gerçek TradingView ruhuyla, bu komut dosyasının mimarı, yatırımcıların işlevselliğini inceleyip doğrulayabilmesi için onu açık kaynaklı hale getirdi. Yazarı tebrik ederiz! Ücretsiz olarak kullanabilseniz de, kodu yeniden yayınlamanın Topluluk Kurallarımıza tabi olduğunu unutmayın.
Feragatname
Bilgiler ve yayınlar, TradingView tarafından sağlanan veya onaylanan finansal, yatırım, alım satım veya diğer türden tavsiye veya öneriler anlamına gelmez ve teşkil etmez. Kullanım Koşulları bölümünde daha fazlasını okuyun.