OPEN-SOURCE SCRIPT
Güncellendi Premium & Discount Zones with Bias
═══════════════════════════════════════════════
PREMIUM & DISCOUNT ZONES WITH BIAS
═══════════════════════════════════════════════
A statistical mean-reversion framework that identifies premium (sell) and discount (buy) zones on your entry timeframe, derived from higher-timeframe structure. Built for intraday traders who want meaningful, stable reference levels without the noise of lower-timeframe volatility.
WHAT IT DOES
─────────────────────────────────────────────
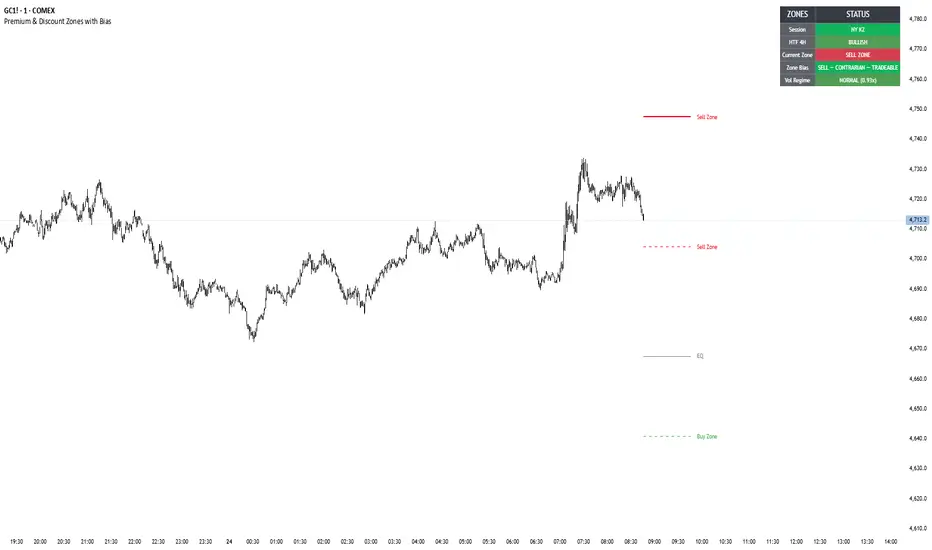
This indicator projects five statistical zones from higher-timeframe candle distributions:
• Upper Sell Zone (95th percentile) — extreme premium, mean reversion likely
• Sell Zone (75th percentile) — standard premium zone
• EQ / Equilibrium (50th percentile) — the statistical midpoint, natural target
• Buy Zone (25th percentile) — standard discount zone
• Lower Buy Zone (5th percentile) — extreme discount, mean reversion likely
The zones are calculated from the distribution of recent higher-timeframe candles (default: 18 × 4H candles = 3 days of structure) using Monte Carlo projection. A Naive Bayes classifier runs on the current chart timeframe to produce a directional bias based on relative volume and momentum.
The key advantage: zones update only when a new HTF candle closes, giving you stable reference levels that stay fixed for hours at a time. No more chasing shifting lines on a 1m chart.
INSPIRATION & CREDIT
─────────────────────────────────────────────
This indicator is inspired by and builds on "Monte Carlo CT [SS]" by © Steversteves, published on TradingView under Mozilla Public License 2.0 at mozilla.org/MPL/2.0/
The original script provided the mathematical foundation of Monte Carlo price projection combined with a Naive Bayes directional classifier. This version reimagines that concept as a premium/discount zone framework: instead of projecting bands forward across the chart, zones are derived from higher-timeframe structure and displayed as stable horizontal reference levels on the entry timeframe. Session awareness, bias table, and full visual customisation have been added for intraday traders.
Full credit and thanks to Steversteves for the original work.
HOW TO USE IT
─────────────────────────────────────────────
RECOMMENDED SETUP
Apply to your entry timeframe (1m, 3m, or 5m recommended). The zones will reflect your chosen higher timeframe (default 4H), giving you structural context without cluttering the entry chart.
CORE CONCEPT
The indicator identifies where price is statistically extended relative to recent structure. When price enters a buy or sell zone, it has a statistical tendency to revert toward the EQ (equilibrium). This is NOT a signal to blindly buy or sell — it is a confluence tool that tells you whether your chosen entry is at a statistically favourable location.
EXAMPLE SETUPS
─────────────────────────────────────────────
BULLISH SETUP (long from discount)
Wait for London or NY kill zone — the Session cell in the table will turn active
Price trades down into the Buy Zone (25th percentile) or Lower Buy Zone (5th percentile)
Check the Bias table — is it showing LONG with elevated probability?
Confirm with your own entry trigger (sweep + reclaim, break of structure, CISD, order block, etc.)
Enter long, targeting EQ as first target or the opposing Sell Zone as runner target
Why this works: you are entering long at a statistically discounted price with directional bias confirmation, targeting the statistical mean or opposing extreme.
BEARISH SETUP (short from premium)
Wait for an active kill zone
Price trades up into the Sell Zone (75th percentile) or Upper Sell Zone (95th percentile)
Check the Bias table — is it showing SHORT with elevated probability?
Confirm with your own entry trigger (failure to break, rejection candle, bearish CISD, etc.)
Enter short, targeting EQ as first target or the opposing Buy Zone as runner target
Why this works: you are selling at a statistically premium price against the likely mean reversion move.
WHAT NOT TO DO
─────────────────────────────────────────────
• Do not trade against the Bias signal. If price is in the Buy Zone but Bias shows SHORT, the setup lacks confluence — skip it
• Do not trade outside active kill zones unless you have another strong edge — the zones are most reliable during high-volume sessions
• Do not treat this indicator as a standalone entry signal. It is a confluence filter that works best combined with your existing framework
• Do not expect zones to hold every time. These are statistical probabilities, not guarantees
SETTINGS EXPLAINED
─────────────────────────────────────────────
ZONE CALCULATION
• Higher Timeframe — Controls which timeframe the zones are derived from. Default 240 (4H) balances structure and responsiveness. For longer-term reference, try Daily. For faster updates, try 60 or 120.
• HTF Candles Lookback — How many HTF candles feed the distribution. Default 18 = 3 days of 4H data. Minimum 10-12 for statistical significance. Higher values give smoother zones; lower values adapt faster to regime changes.
• Use Monte Carlo Projection — ON uses Monte Carlo simulation for distribution projection (more robust, slightly slower). OFF uses direct percentile calculation of historical returns (faster, tighter zones).
• Monte Carlo Simulations — Number of simulation runs when MC is enabled. 200 is the sweet spot. More sims give smoother bands but slower calculation.
• MC Forecast Horizon — How many HTF candles ahead to project. Default 6 × 4H = 24 hours. Increase for longer-term projection, decrease for closer zones.
• Line Offset — How far right the horizontal zone lines extend on your chart. Adjust for visual preference.
BIAS CLASSIFIER SETTINGS
• NB Train Lookback — Training window in current chart bars for the Naive Bayes classifier. Default 240.
• NB Momentum Period — ROC period for the momentum feature. Higher = smoother and less noisy on low timeframes. Default 30.
KILL ZONES
• London and NY kill zone windows in NY time. Adjust if you trade different sessions or different time zones.
COLOURS
• Fully customisable for both the zone lines and the bias table. Separate controls for background, borders, header text, label text, value text, and all highlight colours. Works on both light and dark chart themes.
TABLE DISPLAY
• Toggle table on/off
• Six position options (top/middle/bottom × left/right)
• Three size options: Normal, Small, Tiny
ALERTS
─────────────────────────────────────────────
Two alert conditions are available:
• Price entered BUY ZONE — when close drops below the 25th percentile line
• Price entered SELL ZONE — when close rises above the 75th percentile line
Set these as audio alerts if you want to focus on other charts and be notified only when price reaches a zone.
INSTRUMENTS & TIMEFRAMES
─────────────────────────────────────────────
This indicator is designed for:
• Futures (Gold, Silver, Indices, Oil, etc.)
• Forex majors
• Major crypto pairs
Best performance on liquid instruments with consistent volume. Recommended entry timeframes: 1m, 3m, 5m. Recommended higher timeframe for zones: 4H (default), 2H for faster updates, Daily for swing trading.
FINAL NOTES
─────────────────────────────────────────────
This is a confluence indicator, not a signal generator. Use it in combination with your own entry methodology — order flow reading, structure analysis, liquidity concepts, or any systematic entry framework.
The zones tell you WHERE. Your framework tells you WHEN.
Feedback and suggestions welcome. Trade safe.
PREMIUM & DISCOUNT ZONES WITH BIAS
═══════════════════════════════════════════════
A statistical mean-reversion framework that identifies premium (sell) and discount (buy) zones on your entry timeframe, derived from higher-timeframe structure. Built for intraday traders who want meaningful, stable reference levels without the noise of lower-timeframe volatility.
WHAT IT DOES
─────────────────────────────────────────────
This indicator projects five statistical zones from higher-timeframe candle distributions:
• Upper Sell Zone (95th percentile) — extreme premium, mean reversion likely
• Sell Zone (75th percentile) — standard premium zone
• EQ / Equilibrium (50th percentile) — the statistical midpoint, natural target
• Buy Zone (25th percentile) — standard discount zone
• Lower Buy Zone (5th percentile) — extreme discount, mean reversion likely
The zones are calculated from the distribution of recent higher-timeframe candles (default: 18 × 4H candles = 3 days of structure) using Monte Carlo projection. A Naive Bayes classifier runs on the current chart timeframe to produce a directional bias based on relative volume and momentum.
The key advantage: zones update only when a new HTF candle closes, giving you stable reference levels that stay fixed for hours at a time. No more chasing shifting lines on a 1m chart.
INSPIRATION & CREDIT
─────────────────────────────────────────────
This indicator is inspired by and builds on "Monte Carlo CT [SS]" by © Steversteves, published on TradingView under Mozilla Public License 2.0 at mozilla.org/MPL/2.0/
The original script provided the mathematical foundation of Monte Carlo price projection combined with a Naive Bayes directional classifier. This version reimagines that concept as a premium/discount zone framework: instead of projecting bands forward across the chart, zones are derived from higher-timeframe structure and displayed as stable horizontal reference levels on the entry timeframe. Session awareness, bias table, and full visual customisation have been added for intraday traders.
Full credit and thanks to Steversteves for the original work.
HOW TO USE IT
─────────────────────────────────────────────
RECOMMENDED SETUP
Apply to your entry timeframe (1m, 3m, or 5m recommended). The zones will reflect your chosen higher timeframe (default 4H), giving you structural context without cluttering the entry chart.
CORE CONCEPT
The indicator identifies where price is statistically extended relative to recent structure. When price enters a buy or sell zone, it has a statistical tendency to revert toward the EQ (equilibrium). This is NOT a signal to blindly buy or sell — it is a confluence tool that tells you whether your chosen entry is at a statistically favourable location.
EXAMPLE SETUPS
─────────────────────────────────────────────
BULLISH SETUP (long from discount)
Wait for London or NY kill zone — the Session cell in the table will turn active
Price trades down into the Buy Zone (25th percentile) or Lower Buy Zone (5th percentile)
Check the Bias table — is it showing LONG with elevated probability?
Confirm with your own entry trigger (sweep + reclaim, break of structure, CISD, order block, etc.)
Enter long, targeting EQ as first target or the opposing Sell Zone as runner target
Why this works: you are entering long at a statistically discounted price with directional bias confirmation, targeting the statistical mean or opposing extreme.
BEARISH SETUP (short from premium)
Wait for an active kill zone
Price trades up into the Sell Zone (75th percentile) or Upper Sell Zone (95th percentile)
Check the Bias table — is it showing SHORT with elevated probability?
Confirm with your own entry trigger (failure to break, rejection candle, bearish CISD, etc.)
Enter short, targeting EQ as first target or the opposing Buy Zone as runner target
Why this works: you are selling at a statistically premium price against the likely mean reversion move.
WHAT NOT TO DO
─────────────────────────────────────────────
• Do not trade against the Bias signal. If price is in the Buy Zone but Bias shows SHORT, the setup lacks confluence — skip it
• Do not trade outside active kill zones unless you have another strong edge — the zones are most reliable during high-volume sessions
• Do not treat this indicator as a standalone entry signal. It is a confluence filter that works best combined with your existing framework
• Do not expect zones to hold every time. These are statistical probabilities, not guarantees
SETTINGS EXPLAINED
─────────────────────────────────────────────
ZONE CALCULATION
• Higher Timeframe — Controls which timeframe the zones are derived from. Default 240 (4H) balances structure and responsiveness. For longer-term reference, try Daily. For faster updates, try 60 or 120.
• HTF Candles Lookback — How many HTF candles feed the distribution. Default 18 = 3 days of 4H data. Minimum 10-12 for statistical significance. Higher values give smoother zones; lower values adapt faster to regime changes.
• Use Monte Carlo Projection — ON uses Monte Carlo simulation for distribution projection (more robust, slightly slower). OFF uses direct percentile calculation of historical returns (faster, tighter zones).
• Monte Carlo Simulations — Number of simulation runs when MC is enabled. 200 is the sweet spot. More sims give smoother bands but slower calculation.
• MC Forecast Horizon — How many HTF candles ahead to project. Default 6 × 4H = 24 hours. Increase for longer-term projection, decrease for closer zones.
• Line Offset — How far right the horizontal zone lines extend on your chart. Adjust for visual preference.
BIAS CLASSIFIER SETTINGS
• NB Train Lookback — Training window in current chart bars for the Naive Bayes classifier. Default 240.
• NB Momentum Period — ROC period for the momentum feature. Higher = smoother and less noisy on low timeframes. Default 30.
KILL ZONES
• London and NY kill zone windows in NY time. Adjust if you trade different sessions or different time zones.
COLOURS
• Fully customisable for both the zone lines and the bias table. Separate controls for background, borders, header text, label text, value text, and all highlight colours. Works on both light and dark chart themes.
TABLE DISPLAY
• Toggle table on/off
• Six position options (top/middle/bottom × left/right)
• Three size options: Normal, Small, Tiny
ALERTS
─────────────────────────────────────────────
Two alert conditions are available:
• Price entered BUY ZONE — when close drops below the 25th percentile line
• Price entered SELL ZONE — when close rises above the 75th percentile line
Set these as audio alerts if you want to focus on other charts and be notified only when price reaches a zone.
INSTRUMENTS & TIMEFRAMES
─────────────────────────────────────────────
This indicator is designed for:
• Futures (Gold, Silver, Indices, Oil, etc.)
• Forex majors
• Major crypto pairs
Best performance on liquid instruments with consistent volume. Recommended entry timeframes: 1m, 3m, 5m. Recommended higher timeframe for zones: 4H (default), 2H for faster updates, Daily for swing trading.
FINAL NOTES
─────────────────────────────────────────────
This is a confluence indicator, not a signal generator. Use it in combination with your own entry methodology — order flow reading, structure analysis, liquidity concepts, or any systematic entry framework.
The zones tell you WHERE. Your framework tells you WHEN.
Feedback and suggestions welcome. Trade safe.
Sürüm Notları
PREMIUM & DISCOUNT ZONES WITH BIASA statistical mean-reversion framework that identifies premium (sell) and discount (buy) zones on your entry timeframe, derived from higher-timeframe structure. Stable reference levels without the noise of lower-timeframe volatility.
─────────────────────────────────────────
WHAT IT DOES
Projects five statistical zones from higher-timeframe candle distributions:
• Upper Sell Zone (95th percentile) — extreme premium
• Sell Zone (75th percentile) — standard premium
• EQ (50th percentile) — statistical midpoint / target
• Buy Zone (25th percentile) — standard discount
• Lower Buy Zone (5th percentile) — extreme discount
Zones are calculated from recent HTF candles (default: 18 × 4H) via Monte Carlo projection. A Naive Bayes classifier runs on the current chart to produce a directional bias based on volume and momentum.
Zones update only when a new HTF candle closes — stable reference levels that stay fixed for hours.
─────────────────────────────────────────
INSPIRATION & CREDIT
Inspired by "Monte Carlo CT [SS]" by © Steversteves, published under Mozilla Public License 2.0 (mozilla.org/MPL/2.0/). The original provided the foundation of Monte Carlo projection + Naive Bayes classification. This version reimagines that as a premium/discount zone framework with HTF-derived stable zones, session awareness for Asia/London/NY kill zones, and a streamlined bias table.
Full credit and thanks to Steversteves.
─────────────────────────────────────────
EXAMPLE SETUPS
BULLISH (long from discount)
Active London/NY kill zone (Session cell shows active)
Price trades into Buy Zone (25th percentile) or deeper
Bias table confirms LONG probability elevated
Confirm with your own entry trigger (sweep, BOS, CISD, order block)
Enter long, target EQ or opposing Sell Zone
BEARISH (short from premium)
Active kill zone
Price trades into Sell Zone (75th percentile) or higher
Bias table confirms SHORT probability elevated
Confirm with your own entry trigger
Enter short, target EQ or opposing Buy Zone
─────────────────────────────────────────
WHAT NOT TO DO
• Don't trade against the Bias signal — conflicting direction = skip
• Don't trade outside kill zones unless another strong edge exists
• Don't treat this as a standalone entry signal — it's a confluence filter
• Zones are statistical probabilities, not guarantees
─────────────────────────────────────────
KEY SETTINGS
• Higher Timeframe — Default 240 (4H). Try Daily for swing, 60/120 for faster updates
• HTF Candles Lookback — Default 18 (3 days of 4H). Minimum 10-12 for significance
• Monte Carlo Projection — ON for simulation-based zones, OFF for direct percentiles
• Kill Zones — Asia/London/NY with individual toggles and customisable hours (NY time)
• Full colour customisation — Works on both dark and light chart themes
• Table size — Normal, Small, or Tiny
─────────────────────────────────────────
ALERTS
• Price entered BUY ZONE
• Price entered SELL ZONE
Set audio alerts to focus on other charts and be notified only when price reaches a zone.
─────────────────────────────────────────
RECOMMENDED USE
Entry timeframe: 1m, 3m, or 5m
HTF for zones: 4H (default), 2H for faster, Daily for swing
Instruments: Liquid futures (Gold, Silver, Indices, Oil), forex majors, major crypto pairs
─────────────────────────────────────────
FINAL NOTE
This is a confluence indicator, not a signal generator. Use alongside your own entry methodology — order flow, structure, liquidity concepts, or any systematic framework.
The zones tell you WHERE. Your framework tells you WHEN.
Sürüm Notları
═══════════════════════════════════════════════════════PREMIUM & DISCOUNT ZONES WITH BIAS v7
═══════════════════════════════════════════════════════
A statistical mean-reversion zone indicator with HTF contrarian
bias detection, built for intraday traders working on 1m-5m charts.
🎯 WHAT IT DOES
Calculates statistical premium and discount zones from the last
18 × 4H candles using return distribution analysis. Zones project
forward onto your lower timeframe chart as horizontal levels that
remain stable until the next 4H candle closes.
The indicator then tells you WHICH zone entries are tradeable
based on HTF trend context — the key research finding that
separates this from standard percentile indicators.
📊 ZONES DISPLAYED
- P95 — Extreme premium (statistical ceiling)
- P75 — Premium zone
- P50 — Equilibrium (EQ)
- P25 — Discount zone
- P05 — Extreme discount (statistical floor)
Each zone is a horizontal line offset from the current 4H close
using the recent return distribution. Price reaching P95 or P05
represents a statistically rare extension.
🎯 THE HTF CONTRARIAN FILTER (new in v7)
Not every zone touch is tradeable. The indicator reads the current
4H candle direction and classifies zone entries:
- P95 + 4H BULLISH = TRADEABLE SHORT (price overextended upward)
- P05 + 4H BEARISH = TRADEABLE LONG (price overextended downward)
- P95 + 4H BEARISH = SKIP (trend continuation risk)
- P05 + 4H BULLISH = SKIP (trend continuation risk)
Contrarian setups catch price at its statistical extreme against
prevailing flow — the highest-probability mean-reversion moment.
📈 BULLISH EXAMPLE (tradeable long)
Price drops through the P05 extreme discount zone during the
NY session. The 4H candle is BEARISH. The table shows:
- Session: NY KZ (highlighted green)
- HTF 4H: BEARISH
- Current Zone: BUY ZONE (P05)
- Zone Bias: CONTRARIAN — TRADEABLE (green)
- Vol Regime: NORMAL (1.15x)
Interpretation: Price has stretched to its statistical floor
while 4H momentum is already bearish — sellers have pushed too
far, setting up a snapback. Wait for your own entry trigger
(bullish order block, sweep of P05 + reclaim, CISD) within the
buy zone. Target: EQ (P50) or first reaction at P25.
📉 BEARISH EXAMPLE (tradeable short)
Price pushes through the P95 extreme premium zone during the
London session. The 4H candle is BULLISH. The table shows:
- Session: LONDON KZ (highlighted green)
- HTF 4H: BULLISH
- Current Zone: SELL ZONE (P95)
- Zone Bias: CONTRARIAN — TRADEABLE (green)
- Vol Regime: NORMAL (1.08x)
Interpretation: Price has stretched to its statistical ceiling
while 4H momentum is already bullish — buyers have exhausted at
an overextension, setting up a reversion. Wait for your own
entry trigger (bearish order block, sweep of P95 + reject,
CISD) within the sell zone. Target: EQ (P50) or first reaction
at P75.
❌ SKIP EXAMPLES
- P95 + 4H BEARISH — price hits premium zone but 4H is already
selling off. The zone reading is likely noise — price is
trending lower, not overextending. SKIP.
- P05 + 4H BULLISH — price hits discount zone in a bullish 4H
candle. Likely a pullback within an uptrend, not a reversion
opportunity. SKIP.
⚠️ ATR REGIME WARNING
Extreme volatility degrades zone reliability:
- NORMAL VOL (ATR ratio < 1.2) — zones most reliable
- ELEVATED VOL (1.2 – 1.4) — monitor closely
- EXTREME VOL (≥ 1.4) — zone signals unreliable, caution advised
🕐 SESSION CONTEXT
Current session shown in the bias table. NY and NY PM sessions
highlighted in green — historically the strongest sessions for
zone mean reversion.
📋 BIAS TABLE
Compact, customisable table displays:
- Current session
- HTF 4H direction (Bullish/Bearish)
- Current zone position
- Zone bias (TRADEABLE or SKIP with reasoning)
- Volatility regime
🔔 ALERTS
- Tradeable SELL zone signal (P95 + 4H bullish + NY session)
- Tradeable BUY zone signal (P05 + 4H bearish + NY session)
- Extreme volatility warning
- Zone entry alerts (all zones, unfiltered)
⚙️ CUSTOMISATION
- Full light/dark mode support with editable table colours
- Table position (6 options)
- Table size (Normal / Small / Tiny)
- Toggle Asia / London / NY kill zones independently
- Adjustable 4H candle lookback period
- Configurable ATR regime thresholds
📚 USAGE NOTES
Designed for intraday futures and FX traders. Works on any
liquid instrument with sufficient 4H bar history. Most effective
on instruments with clear mean-reversion behaviour during
consolidation.
Best confluence workflow:
1. Wait for TRADEABLE signal in the bias table
2. Confirm normal volatility regime
3. Trade only during NY or London sessions for strongest results
4. Use your own entry trigger within the zone (OB, sweep,
structure break)
5. Target EQ (P50) as primary, partial profits at intermediate
zones
This is a CONFLUENCE TOOL, not a standalone signal. The bias
table shows when conditions align — entry timing and risk
management remain your responsibility.
🙏 CREDITS
Based on Monte Carlo CT [SS] by Steversteves, licensed under
Mozilla Public License 2.0.
MPL 2.0: mozilla.org/MPL/2.0/
═══════════════════════════════════════════════════════
Disclaimer: Educational and analytical use only. Past
performance does not guarantee future results. Use proper
risk management. Not financial advice.
═══════════════════════════════════════════════════════
Sürüm Notları
v7.2 — ATR filter inversion (verified backtest finding) + UI alignmentTargeted audit revealed the ATR regime filter direction was inverted from optimal. The original v7 used atr_ratio < 1.4 for tradeable signals. Re-running the canonical research methodology (zone_validation.cjs spec) on TZ-corrected data showed the opposite is true:
- Below 1.4 ATR (was tradeable): PF 2.44
- Above 1.4 ATR (was filtered): PF 4.28
The relationship is monotonic across ATR buckets. Sanity-check splits confirm robustness:
- Holds on no-news days (+0.78 PF lift)
- Holds on both directions (asymmetric: short fades benefit more)
- Holds across both halves of dataset
CHANGES IN v7.2:
- ATR filter direction inverted: atr_ratio >= 1.4 now triggers tradeable signal
- Vol regime label and color updated to match inverted filter (EXPANSION at >= 1.4 ATR is now visually marked as the tradeable regime, not warning red)
- Threshold value (1.4) kept the same
- Architecture and other filters unchanged
INTERPRETATION:
The finding is counter-intuitive (standard logic says high ATR = expansion = fades get run over). Likely explanation: at zone extremes specifically, high ATR marks exhaustion not continuation.
USE GUIDANCE:
Marked as 'BACKTEST FINDING — verify before live use' in the v7.2 comment block. Recommend paper-trade or sim verification before sizing live. Will drop the disclaimer in v7.3 once live behavior confirms.
Caveats:
- Direction asymmetry: short fades show stronger edge improvement than long fades
- Mild edge compression in H2 vs H1 (still positive)
- Re-audit recommended in 3-6 months
— Frankie
Açık kaynak kodlu komut dosyası
Gerçek TradingView ruhuyla, bu komut dosyasının mimarı, yatırımcıların işlevselliğini inceleyip doğrulayabilmesi için onu açık kaynaklı hale getirdi. Yazarı tebrik ederiz! Ücretsiz olarak kullanabilseniz de, kodu yeniden yayınlamanın Topluluk Kurallarımıza tabi olduğunu unutmayın.

Feragatname
Bilgiler ve yayınlar, TradingView tarafından sağlanan veya onaylanan finansal, yatırım, alım satım veya diğer türden tavsiye veya öneriler anlamına gelmez ve teşkil etmez. Kullanım Koşulları bölümünde daha fazlasını okuyun.
Açık kaynak kodlu komut dosyası
Gerçek TradingView ruhuyla, bu komut dosyasının mimarı, yatırımcıların işlevselliğini inceleyip doğrulayabilmesi için onu açık kaynaklı hale getirdi. Yazarı tebrik ederiz! Ücretsiz olarak kullanabilseniz de, kodu yeniden yayınlamanın Topluluk Kurallarımıza tabi olduğunu unutmayın.
Feragatname
Bilgiler ve yayınlar, TradingView tarafından sağlanan veya onaylanan finansal, yatırım, alım satım veya diğer türden tavsiye veya öneriler anlamına gelmez ve teşkil etmez. Kullanım Koşulları bölümünde daha fazlasını okuyun.