OPEN-SOURCE SCRIPT
EMA Rejection Counter
EMA Rejection Counter
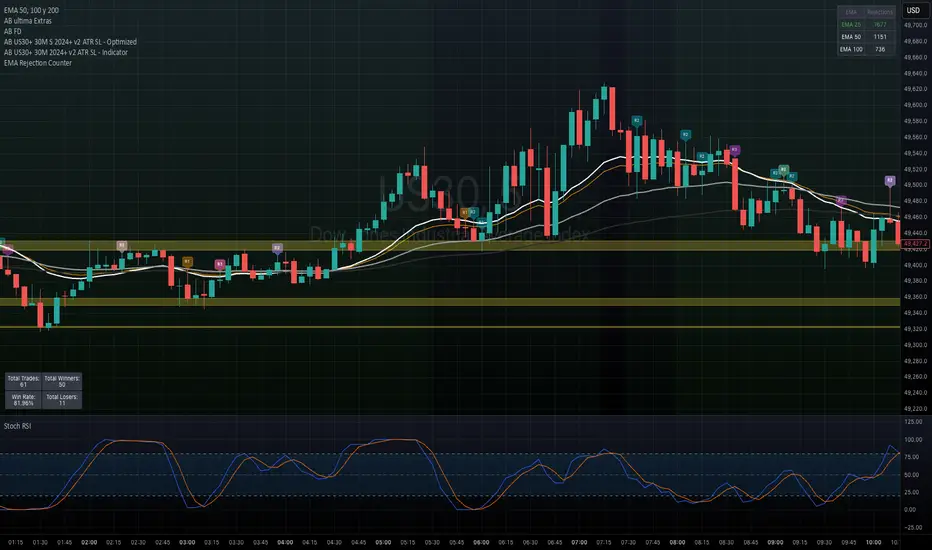
EMA Rejection Counter is a simple yet powerful tool designed to measure how often price gets rejected from key exponential moving averages. Instead of guessing which EMA “respects price” the most, this indicator gives you actual data.
What It Does
This indicator tracks and counts rejection events on up to three customizable EMAs.
A rejection is defined as:
Price approaches the EMA
Touches the EMA during the candle
Then closes away from it
This helps identify which EMA is acting as the most reliable dynamic support/resistance.
Features
✅ Track 3 customizable EMAs (default: 25 / 50 / 100)
✅ Automatic detection of bullish & bearish rejections
✅ Live rejection counter for each EMA
✅ On-chart labels (R1, R2, R3) to visualize rejection points
✅ Clean table display showing total counts
✅ Highlights the most respected EMA in real-time
How to Use
Use this tool to identify which EMA price is reacting to most
Combine with your trend strategy (e.g., pullbacks, continuations)
The EMA with the highest rejection count often acts as the key level
Example Use Cases
Finding the best EMA for your strategy
Confirming dynamic support/resistance
Filtering entries based on EMA reactions
Enhancing trend-following systems
Notes
This is a statistical tool, not a standalone trading signal
Works best when combined with price action and market structure
Results may vary across timeframes and assets
EMA Rejection Counter is a simple yet powerful tool designed to measure how often price gets rejected from key exponential moving averages. Instead of guessing which EMA “respects price” the most, this indicator gives you actual data.
What It Does
This indicator tracks and counts rejection events on up to three customizable EMAs.
A rejection is defined as:
Price approaches the EMA
Touches the EMA during the candle
Then closes away from it
This helps identify which EMA is acting as the most reliable dynamic support/resistance.
Features
✅ Track 3 customizable EMAs (default: 25 / 50 / 100)
✅ Automatic detection of bullish & bearish rejections
✅ Live rejection counter for each EMA
✅ On-chart labels (R1, R2, R3) to visualize rejection points
✅ Clean table display showing total counts
✅ Highlights the most respected EMA in real-time
How to Use
Use this tool to identify which EMA price is reacting to most
Combine with your trend strategy (e.g., pullbacks, continuations)
The EMA with the highest rejection count often acts as the key level
Example Use Cases
Finding the best EMA for your strategy
Confirming dynamic support/resistance
Filtering entries based on EMA reactions
Enhancing trend-following systems
Notes
This is a statistical tool, not a standalone trading signal
Works best when combined with price action and market structure
Results may vary across timeframes and assets
Açık kaynak kodlu komut dosyası
Gerçek TradingView ruhuyla, bu komut dosyasının mimarı, yatırımcıların işlevselliğini inceleyip doğrulayabilmesi için onu açık kaynaklı hale getirdi. Yazarı tebrik ederiz! Ücretsiz olarak kullanabilseniz de, kodu yeniden yayınlamanın Topluluk Kurallarımıza tabi olduğunu unutmayın.

Feragatname
Bilgiler ve yayınlar, TradingView tarafından sağlanan veya onaylanan finansal, yatırım, alım satım veya diğer türden tavsiye veya öneriler anlamına gelmez ve teşkil etmez. Kullanım Koşulları bölümünde daha fazlasını okuyun.
Açık kaynak kodlu komut dosyası
Gerçek TradingView ruhuyla, bu komut dosyasının mimarı, yatırımcıların işlevselliğini inceleyip doğrulayabilmesi için onu açık kaynaklı hale getirdi. Yazarı tebrik ederiz! Ücretsiz olarak kullanabilseniz de, kodu yeniden yayınlamanın Topluluk Kurallarımıza tabi olduğunu unutmayın.
Feragatname
Bilgiler ve yayınlar, TradingView tarafından sağlanan veya onaylanan finansal, yatırım, alım satım veya diğer türden tavsiye veya öneriler anlamına gelmez ve teşkil etmez. Kullanım Koşulları bölümünde daha fazlasını okuyun.