OPEN-SOURCE SCRIPT
Güncellendi Swing Failure Pattern (SFP) Engine [AGPro Series]
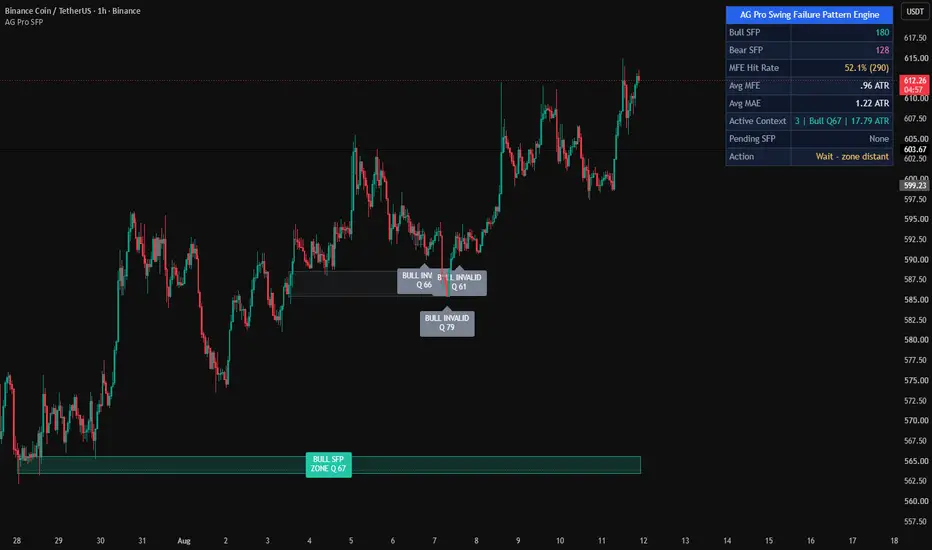
Swing Failure Pattern (SFP) Engine [AGPro Series]
────────────────────────────────────────────────────────────
OVERVIEW
────────────────────────────────────────────────────────────
Swing Failure Pattern (SFP) Engine detects high-probability liquidity sweep
events at prior swing highs and lows. An SFP occurs when price pierces a
recent swing level with a long wick but closes back inside the prior range,
signalling failed continuation and potential mean reversion. Each event is
scored on four components, drawn as a mid-sized support/resistance reaction
zone, and tracked through its live cycle — with panel statistics on MFE,
MAE, and hit rate. Designed for visual pattern reading and confluence;
not a buy/sell system.
────────────────────────────────────────────────────────────
UNIQUE EDGE
────────────────────────────────────────────────────────────
Most SFP indicators mark the sweep candle and stop there. This engine treats
each SFP as a living support/resistance band: the zone extends to the right
every bar and only freezes when the swept level is actually broken on close.
That preserves the SR context that traders use in real decisions, without
cluttering charts with zones that never die. A composite score (0-100),
confluence grouping of nearby events within 0.5 ATR, and live MFE/MAE
tracking in ATR units turn a common pattern into a measurable framework.
────────────────────────────────────────────────────────────
METHODOLOGY
────────────────────────────────────────────────────────────
Swing detection uses pivot highs and lows confirmed by a configurable
lookback. An SFP is confirmed on bar close when four conditions are met:
1. The bar wicks beyond a prior unswept swing high (bearish) or swing low
(bullish) within the active lookback window.
2. The close reclaims the prior range by at least the user-defined ATR
distance (default 0.25 ATR).
3. The sweep-side wick represents at least the minimum wick ratio of total
bar range (default 55 percent).
4. Bar volume exceeds its 20-period SMA by the configured multiplier
(optional, default 1.15x).
Composite score (0-100) weights wick ratio (40), reclaim distance in ATR
(30), volume confirmation (15), and swing age (15). Only events above the
minimum score threshold are drawn. Each confirmed SFP removes its swept
swing from the active array to prevent re-triggering on the same level.
Confluence grouping merges same-side events within 0.5 ATR into a single
labelled zone with an x2, x3 count.
────────────────────────────────────────────────────────────
SIGNALS & ALERTS
───────────────────────────────────────────────────────────
Visual signals on chart:
- State-coloured label at the sweep bar reading Bull SFP or Bear SFP with
the composite score (e.g., Bull SFP 74). Confluence-grouped events are
suffixed with the merge count (e.g., Bear SFP 81 x2).
- Rectangular zone spanning the swept level and the SFP close, with a
small ATR buffer. The zone extends right each bar while active and
freezes in neutral grey when the swept level breaks.
- Dotted horizontal line marking the swept swing level.
- Dashed projection line indicating the reversal direction.
Alert conditions:
- Bullish SFP: fires on the confirmation bar of a bullish event above
the score threshold.
- Bearish SFP: same, for bearish events.
- Zone Invalidation (optional): fires when an active zone's swept level
is broken on close.
────────────────────────────────────────────────────────────
KEY INPUTS
────────────────────────────────────────────────────────────
Detection:
- Swing Pivot Length - bars each side of a pivot (default 5).
- Swing Lookback - how far back active swings are tracked (default 120).
- Min Wick Ratio - minimum sweep wick as fraction of bar range (0.55).
- Min Reclaim Distance (ATR) - how far close must reclaim (0.25 ATR).
- Require Above-Average Volume and Volume Multiplier (default 1.15x).
- ATR Length (default 14).
Scoring & Filters:
- Min SFP Score (default 55 of 100).
- Max Active Zones retained on chart (default 8).
- Stats Timeout - bars after which an unresolved event is counted in
averages (default 30). Does not affect zone visibility.
Visuals:
- Zone transparency (default 80), confluence grouping distance (0.5 ATR),
label size, and toggles for zones, swing lines, and reversal projections.
Panel:
- Location (8 options), Dark/Light theme, text size.
Alerts:
- Independent toggles for bullish, bearish, and invalidation alerts.
────────────────────────────────────────────────────────────
HOW TO USE
────────────────────────────────────────────────────────────
Apply the indicator to any chart and timeframe. Higher timeframes (1h and
above) produce cleaner swings; lower timeframes require a higher Min Wick
Ratio and Min Score to filter noise.
Read SFPs as liquidity sweep events, not standalone entries. A bullish SFP
below a prior swing low indicates that sellers failed to extend the move —
often a location where larger participants accumulate. The score reflects
sweep quality; higher scores (70+) generally correspond to cleaner
rejections. Use the zone as a support/resistance reference until it is
invalidated.
Panel statistics describe the observed sample on the loaded chart, not a
backtested system. MFE Hit Rate is the percent of resolved zones that
reached 1 ATR in the SFP direction before the swept level broke — it is a
quality reference, not a win rate for any trading strategy.
────────────────────────────────────────────────────────────
LIMITATIONS & TRANSPARENCY
────────────────────────────────────────────────────────────
- Signals confirm on bar close; intrabar conditions may change until close.
- Pivot detection introduces a natural bars-of-right-context lag equal to
the Pivot Length. This is intrinsic to any pivot-based approach.
- Panel statistics reflect events visible on the current chart load and
will vary with timeframe, symbol, and bar range.
- MFE Hit Rate is not a profit expectation. It measures whether price
moved 1 ATR in the SFP direction before the swept level broke.
- Volume confirmation uses chart volume and may behave differently on
symbols with inconsistent volume data.
- The indicator uses standard Pine Script drawing objects. Chart reload
may reset ephemeral visual states of resolved zones.
────────────────────────────────────────────────────────────
RISK DISCLOSURE
────────────────────────────────────────────────────────────
This indicator is a visualisation and analysis tool. It is not a trading
system, not financial advice, and not a signal service. It does not
predict future price movement. All trading decisions carry risk of loss
and are the sole responsibility of the user. Historical pattern behaviour
does not guarantee future results. Test thoroughly on your instruments
and timeframes before making any decisions.
────────────────────────────────────────────────────────────
OVERVIEW
────────────────────────────────────────────────────────────
Swing Failure Pattern (SFP) Engine detects high-probability liquidity sweep
events at prior swing highs and lows. An SFP occurs when price pierces a
recent swing level with a long wick but closes back inside the prior range,
signalling failed continuation and potential mean reversion. Each event is
scored on four components, drawn as a mid-sized support/resistance reaction
zone, and tracked through its live cycle — with panel statistics on MFE,
MAE, and hit rate. Designed for visual pattern reading and confluence;
not a buy/sell system.
────────────────────────────────────────────────────────────
UNIQUE EDGE
────────────────────────────────────────────────────────────
Most SFP indicators mark the sweep candle and stop there. This engine treats
each SFP as a living support/resistance band: the zone extends to the right
every bar and only freezes when the swept level is actually broken on close.
That preserves the SR context that traders use in real decisions, without
cluttering charts with zones that never die. A composite score (0-100),
confluence grouping of nearby events within 0.5 ATR, and live MFE/MAE
tracking in ATR units turn a common pattern into a measurable framework.
────────────────────────────────────────────────────────────
METHODOLOGY
────────────────────────────────────────────────────────────
Swing detection uses pivot highs and lows confirmed by a configurable
lookback. An SFP is confirmed on bar close when four conditions are met:
1. The bar wicks beyond a prior unswept swing high (bearish) or swing low
(bullish) within the active lookback window.
2. The close reclaims the prior range by at least the user-defined ATR
distance (default 0.25 ATR).
3. The sweep-side wick represents at least the minimum wick ratio of total
bar range (default 55 percent).
4. Bar volume exceeds its 20-period SMA by the configured multiplier
(optional, default 1.15x).
Composite score (0-100) weights wick ratio (40), reclaim distance in ATR
(30), volume confirmation (15), and swing age (15). Only events above the
minimum score threshold are drawn. Each confirmed SFP removes its swept
swing from the active array to prevent re-triggering on the same level.
Confluence grouping merges same-side events within 0.5 ATR into a single
labelled zone with an x2, x3 count.
────────────────────────────────────────────────────────────
SIGNALS & ALERTS
───────────────────────────────────────────────────────────
Visual signals on chart:
- State-coloured label at the sweep bar reading Bull SFP or Bear SFP with
the composite score (e.g., Bull SFP 74). Confluence-grouped events are
suffixed with the merge count (e.g., Bear SFP 81 x2).
- Rectangular zone spanning the swept level and the SFP close, with a
small ATR buffer. The zone extends right each bar while active and
freezes in neutral grey when the swept level breaks.
- Dotted horizontal line marking the swept swing level.
- Dashed projection line indicating the reversal direction.
Alert conditions:
- Bullish SFP: fires on the confirmation bar of a bullish event above
the score threshold.
- Bearish SFP: same, for bearish events.
- Zone Invalidation (optional): fires when an active zone's swept level
is broken on close.
────────────────────────────────────────────────────────────
KEY INPUTS
────────────────────────────────────────────────────────────
Detection:
- Swing Pivot Length - bars each side of a pivot (default 5).
- Swing Lookback - how far back active swings are tracked (default 120).
- Min Wick Ratio - minimum sweep wick as fraction of bar range (0.55).
- Min Reclaim Distance (ATR) - how far close must reclaim (0.25 ATR).
- Require Above-Average Volume and Volume Multiplier (default 1.15x).
- ATR Length (default 14).
Scoring & Filters:
- Min SFP Score (default 55 of 100).
- Max Active Zones retained on chart (default 8).
- Stats Timeout - bars after which an unresolved event is counted in
averages (default 30). Does not affect zone visibility.
Visuals:
- Zone transparency (default 80), confluence grouping distance (0.5 ATR),
label size, and toggles for zones, swing lines, and reversal projections.
Panel:
- Location (8 options), Dark/Light theme, text size.
Alerts:
- Independent toggles for bullish, bearish, and invalidation alerts.
────────────────────────────────────────────────────────────
HOW TO USE
────────────────────────────────────────────────────────────
Apply the indicator to any chart and timeframe. Higher timeframes (1h and
above) produce cleaner swings; lower timeframes require a higher Min Wick
Ratio and Min Score to filter noise.
Read SFPs as liquidity sweep events, not standalone entries. A bullish SFP
below a prior swing low indicates that sellers failed to extend the move —
often a location where larger participants accumulate. The score reflects
sweep quality; higher scores (70+) generally correspond to cleaner
rejections. Use the zone as a support/resistance reference until it is
invalidated.
Panel statistics describe the observed sample on the loaded chart, not a
backtested system. MFE Hit Rate is the percent of resolved zones that
reached 1 ATR in the SFP direction before the swept level broke — it is a
quality reference, not a win rate for any trading strategy.
────────────────────────────────────────────────────────────
LIMITATIONS & TRANSPARENCY
────────────────────────────────────────────────────────────
- Signals confirm on bar close; intrabar conditions may change until close.
- Pivot detection introduces a natural bars-of-right-context lag equal to
the Pivot Length. This is intrinsic to any pivot-based approach.
- Panel statistics reflect events visible on the current chart load and
will vary with timeframe, symbol, and bar range.
- MFE Hit Rate is not a profit expectation. It measures whether price
moved 1 ATR in the SFP direction before the swept level broke.
- Volume confirmation uses chart volume and may behave differently on
symbols with inconsistent volume data.
- The indicator uses standard Pine Script drawing objects. Chart reload
may reset ephemeral visual states of resolved zones.
────────────────────────────────────────────────────────────
RISK DISCLOSURE
────────────────────────────────────────────────────────────
This indicator is a visualisation and analysis tool. It is not a trading
system, not financial advice, and not a signal service. It does not
predict future price movement. All trading decisions carry risk of loss
and are the sole responsibility of the user. Historical pattern behaviour
does not guarantee future results. Test thoroughly on your instruments
and timeframes before making any decisions.
Sürüm Notları
🔧 UPDATE NOTES - V1.8This update focuses on zone ownership, chart readability, and first-glance clarity.
The core purpose of the script remains unchanged.
This release improves how active SFP zones are identified and read on the chart.
This script continues to function as an analytical and visualization tool.
It does not attempt to predict price direction or provide guaranteed outcomes.
------------------------
What Changed
------------------------
• Added centered SFP zone badges
Active bull and bear SFP zones can now display separate centered badges inside the zone area.
• Added zone badge score option
Users can choose whether the zone badge includes the SFP quality score.
• Improved zone ownership
Each active zone now has clearer visual identity, reducing the chance that a zone looks disconnected from its SFP event.
• Linked badges to zone lifecycle
Zone badges move with expanding zones and fade with invalidated zones when invalidation fade is enabled.
------------------------
Visual Improvements
------------------------
• Improved chart readability by adding centered zone identifiers
• Refined visual hierarchy so active SFP zones stand out without relying on box text
• Preserved clean chart structure by using separate badges instead of embedded zone text
• Improved active zone interpretation on wider screenshots and higher timeframes
------------------------
Interface & Usability
------------------------
• Added Show Zone Badges input
• Added Show Zone Badge Score input
• Zone badges follow the existing label font-size setting
• Existing event labels, panel controls, and zone behavior remain familiar
------------------------
Behavior Notes
------------------------
This update does not change the core SFP detection or scoring logic.
The goal is to improve visual clarity and zone attribution, not to add predictive behavior.
Users should interpret SFP zones the same way as before, now with clearer zone identity.
------------------------
Limitations Reminder
------------------------
The script remains a rule-based analytical tool.
Market conditions such as volatility, liquidity, and timeframe differences may affect how SFP zones appear.
Outputs should always be interpreted within broader market context.
------------------------
Risk Reminder
------------------------
This script is for educational and analytical purposes only.
It does not provide financial advice or guaranteed trading outcomes.
Users remain responsible for their own decisions.
Sürüm Notları
🔧 UPDATE NOTES - v1.9This update focuses on readability and contrast.
The core purpose of the script remains unchanged.
This release improves how the existing swing-failure logic is presented on the
chart and in the panel, without changing detection, scoring, or statistics.
This script continues to function as an analytical and visualization tool.
It does not attempt to predict price direction or provide guaranteed outcomes.
------------------------
What Changed
------------------------
• Stronger Label Contrast
All SFP labels and zone badges now use luminance-based text color, so text is
dark on light fills and light on dark fills. Pink bearish labels and badges are
now fully legible instead of low-contrast.
• Overlap-Free Zone Labels
Each SFP is now labeled by its centered in-zone badge (side and quality score),
and every badge, active or faded, is laid out each bar by an anti-collision pass
so badges never stack or cut into one another, even on higher timeframes. The
extra candle-anchored SFP label is now optional and off by default, because it
duplicated the zone badge at the same level and caused stacking; it can still be
enabled in settings.
• Readable Panel In Every Theme
Panel values now stay legible on all panel themes. Colors that would be too dark
on the dark themes or too light on the clean light theme are automatically
adjusted so every row reads clearly.
• Hit-Rate Sample Size
The MFE Hit Rate now shows how many SFP events have resolved, so the rate can be
read together with its sample size.
• Steadier Volatility Handling
The internal ATR reference now falls back to true range and a minimum tick floor,
so zone sizing, label offsets, and statistics behave consistently on low-range
or illiquid bars.
------------------------
Visual Improvements
------------------------
• Improved chart readability by correcting label and badge text contrast
• Reduced visual clutter where multiple zone badges previously overlapped
• Refined visual hierarchy so active zones and the hit rate read clearly
• Maintained label offsets that keep annotations off the candle bodies
------------------------
Interface & Usability
------------------------
• Improved label, badge, and panel readability for better chart interaction
• Kept default visual settings balanced for a premium publication appearance
• Added resolved-sample context to the hit-rate readout
• Enhanced overall user experience without changing core logic
------------------------
Behavior Notes
------------------------
This update does not change the detection, scoring, or statistics logic.
The goal is to improve clarity and readability, not to introduce new predictive
behavior. Users should interpret outputs the same way as before.
------------------------
Limitations Reminder
------------------------
The script remains a rule-based analytical tool.
Market conditions such as volatility, liquidity, and timeframe differences may
affect how swing failures, zones, and statistics appear.
The hit rate is a descriptive statistic of past SFP events on the current chart
and timeframe. It is not a forecast and will change as the market evolves.
Outputs should always be interpreted within broader market context.
------------------------
Risk Reminder
------------------------
This script is for educational and analytical purposes only.
It does not provide financial advice or guaranteed trading outcomes.
Users remain responsible for their own decisions.
Sürüm Notları
Version 2.0.1 – Resolution SpacingThis refinement preserves the V2.0 detection and zone-lifecycle model while correcting the remaining resolved-badge congestion and preventing distant historical zones from receiving an active tracking instruction.
• Shortened completed-zone text to compact `BULL INVALID` or `BEAR INVALID` badges with a separate quality line.
• Added deterministic horizontal spacing for resolution badges created within six bars of an existing historical marker.
• Added an adjustable Active Context Distance Limit with a default of four ATR.
• Changed the Action row to `Wait - zone distant` when the nearest live zone exceeds that distance limit.
• Retained exact geometric centering for live zone badges and the invalidated-first object-pruning behavior introduced in V2.0.
Açık kaynak kodlu komut dosyası
Gerçek TradingView ruhuyla, bu komut dosyasının mimarı, yatırımcıların işlevselliğini inceleyip doğrulayabilmesi için onu açık kaynaklı hale getirdi. Yazarı tebrik ederiz! Ücretsiz olarak kullanabilseniz de, kodu yeniden yayınlamanın Topluluk Kurallarımıza tabi olduğunu unutmayın.

🧠 Trading Suite - Flagship Workflow
tradingview.com/script/XJmX3p98-Trading-Suite-AGPro-Series/
🔷 Crypto Setup Planner - Multi-Symbol Planner
tradingview.com/script/LgVRo7Ql-Crypto-Setup-Planner-AGPro-Series/
tradingview.com/script/XJmX3p98-Trading-Suite-AGPro-Series/
🔷 Crypto Setup Planner - Multi-Symbol Planner
tradingview.com/script/LgVRo7Ql-Crypto-Setup-Planner-AGPro-Series/
Feragatname
Bilgiler ve yayınlar, TradingView tarafından sağlanan veya onaylanan finansal, yatırım, alım satım veya diğer türden tavsiye veya öneriler anlamına gelmez ve teşkil etmez. Kullanım Koşulları bölümünde daha fazlasını okuyun.
Açık kaynak kodlu komut dosyası
Gerçek TradingView ruhuyla, bu komut dosyasının mimarı, yatırımcıların işlevselliğini inceleyip doğrulayabilmesi için onu açık kaynaklı hale getirdi. Yazarı tebrik ederiz! Ücretsiz olarak kullanabilseniz de, kodu yeniden yayınlamanın Topluluk Kurallarımıza tabi olduğunu unutmayın.
🧠 Trading Suite - Flagship Workflow
tradingview.com/script/XJmX3p98-Trading-Suite-AGPro-Series/
🔷 Crypto Setup Planner - Multi-Symbol Planner
tradingview.com/script/LgVRo7Ql-Crypto-Setup-Planner-AGPro-Series/
tradingview.com/script/XJmX3p98-Trading-Suite-AGPro-Series/
🔷 Crypto Setup Planner - Multi-Symbol Planner
tradingview.com/script/LgVRo7Ql-Crypto-Setup-Planner-AGPro-Series/
Feragatname
Bilgiler ve yayınlar, TradingView tarafından sağlanan veya onaylanan finansal, yatırım, alım satım veya diğer türden tavsiye veya öneriler anlamına gelmez ve teşkil etmez. Kullanım Koşulları bölümünde daha fazlasını okuyun.