Güncellendi
ATR Dashboard Ultra V6.2
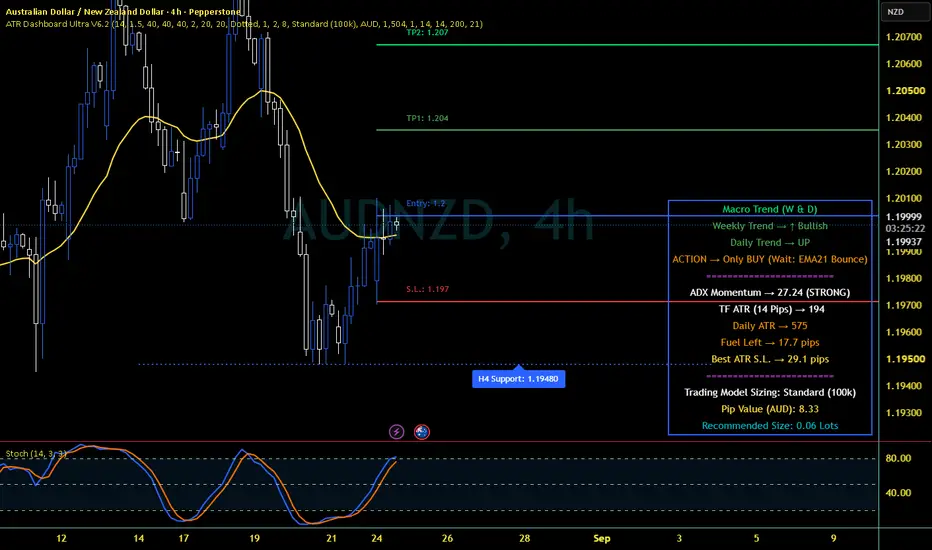
This script covers all information I found important when trade a simple strategy based on EMA(20).
Instead having all indicators showing lines and values and for the traders with the basic plan what reduces the number of indicators this suits my needs when doing my analysis.
It shows straight what I need to know without changing time frames.
Basically we can see on the table is:
-> Macro Trend: The macro trend is defined by the Monthly, Weekly and Daily trend. I just decided to look at the Weekly and Daily. It is enough to understand the market direction and based on that it shows which action should be taken;
-> Tools to help our decision:
ADX Momentum (Average Directional Index): it measures the market strength on an scale from 0 to 100.
ADX values below 20 means a weak or sideways market so no trade;
ADX values between 20 and 25 means the market is trying to stabilize so it may worth to wait for a better value;
ADX values above 25 means the market is showing a better strength and above 50 it is very strong giving us a possible good entry.
ADX Momentum: it measures the market strength on an scale from 0 to 100.
ADX values below 20 means a weak or sideways market so no trade;
ADX values between 20 and 25 means the market is trying to stabilize so it may worth to wait for a better value;
ADX values above 25 means the market is showing a better strength and above 50 it is very strong giving us a possible good entry.
Current time frame ATR (Average True Range): The ATR measures the market volatility meaning it shows us how much the market has moved in a period of time(usually 14 days period) and based on that we can have an idea how much "fuel" (pips) it still can move. This help us to have an idea where the market maybe will stall so we can have an informed decision for our TPs.
Also we use the ATR to calculate the "best" place for our Stop Loss. I use a 1.5 * ATR and this keeps my trade "safe" specially during the NY close where the spread goes very high.
The indicator also shows the trading model sizing for the orders the trade use and based on the pip value for the trade currency it will calculate the size lot.
On the settings for the indicator we can find all options for the ATR values, Trend directions with the option to define Risk/Reward and entry buffer for pending orders.
On the Risk Manager option we can select our currency, account balance and Risk %.
Note that this is an indicator that should be used with other tools like Moving Averages and Stochastics or any indicator the trade uses during analysis.
It helps me to have a straight view of some values during my analysis.
Instead having all indicators showing lines and values and for the traders with the basic plan what reduces the number of indicators this suits my needs when doing my analysis.
It shows straight what I need to know without changing time frames.
Basically we can see on the table is:
-> Macro Trend: The macro trend is defined by the Monthly, Weekly and Daily trend. I just decided to look at the Weekly and Daily. It is enough to understand the market direction and based on that it shows which action should be taken;
-> Tools to help our decision:
ADX Momentum (Average Directional Index): it measures the market strength on an scale from 0 to 100.
ADX values below 20 means a weak or sideways market so no trade;
ADX values between 20 and 25 means the market is trying to stabilize so it may worth to wait for a better value;
ADX values above 25 means the market is showing a better strength and above 50 it is very strong giving us a possible good entry.
ADX Momentum: it measures the market strength on an scale from 0 to 100.
ADX values below 20 means a weak or sideways market so no trade;
ADX values between 20 and 25 means the market is trying to stabilize so it may worth to wait for a better value;
ADX values above 25 means the market is showing a better strength and above 50 it is very strong giving us a possible good entry.
Current time frame ATR (Average True Range): The ATR measures the market volatility meaning it shows us how much the market has moved in a period of time(usually 14 days period) and based on that we can have an idea how much "fuel" (pips) it still can move. This help us to have an idea where the market maybe will stall so we can have an informed decision for our TPs.
Also we use the ATR to calculate the "best" place for our Stop Loss. I use a 1.5 * ATR and this keeps my trade "safe" specially during the NY close where the spread goes very high.
The indicator also shows the trading model sizing for the orders the trade use and based on the pip value for the trade currency it will calculate the size lot.
On the settings for the indicator we can find all options for the ATR values, Trend directions with the option to define Risk/Reward and entry buffer for pending orders.
On the Risk Manager option we can select our currency, account balance and Risk %.
Note that this is an indicator that should be used with other tools like Moving Averages and Stochastics or any indicator the trade uses during analysis.
It helps me to have a straight view of some values during my analysis.
Sürüm Notları
I was checking the indicator and found an error(bad one). No matter the direction based on the Macro Trend the possible trade levels was always to Buy... ooppss.Below is the correct one.
Sorry about that
Sürüm Notları
I finished to develop this indicator last Saturday(23/08/26) and the market was closed. Today, Monday I noticed that the Entry line moves with the close price... like I was casing my tail... :)Now it is fixed and I added some other rules for the Entry line pops up.
- For BUY -> both trends have to be UP; for SELL -> both trends have to be DOWN;
- ADX value has to be greater than 25;
- the price has to bounce at the EMA(21): touch or pierce but must close above(for BUY) or close below(for SELL);
The new bar triggers those rules and if they match a Entry line appears as well as the SL(based on the 1.5 * ATR) and the TPs values based on the selection in the settings.
Sorry about that and you all have a great new trading week.

Feragatname
Bilgiler ve yayınlar, TradingView tarafından sağlanan veya onaylanan finansal, yatırım, alım satım veya diğer türden tavsiye veya öneriler anlamına gelmez ve teşkil etmez. Kullanım Koşulları bölümünde daha fazlasını okuyun.
Feragatname
Bilgiler ve yayınlar, TradingView tarafından sağlanan veya onaylanan finansal, yatırım, alım satım veya diğer türden tavsiye veya öneriler anlamına gelmez ve teşkil etmez. Kullanım Koşulları bölümünde daha fazlasını okuyun.