Previous Day / Week / Month High Low + Sweeps
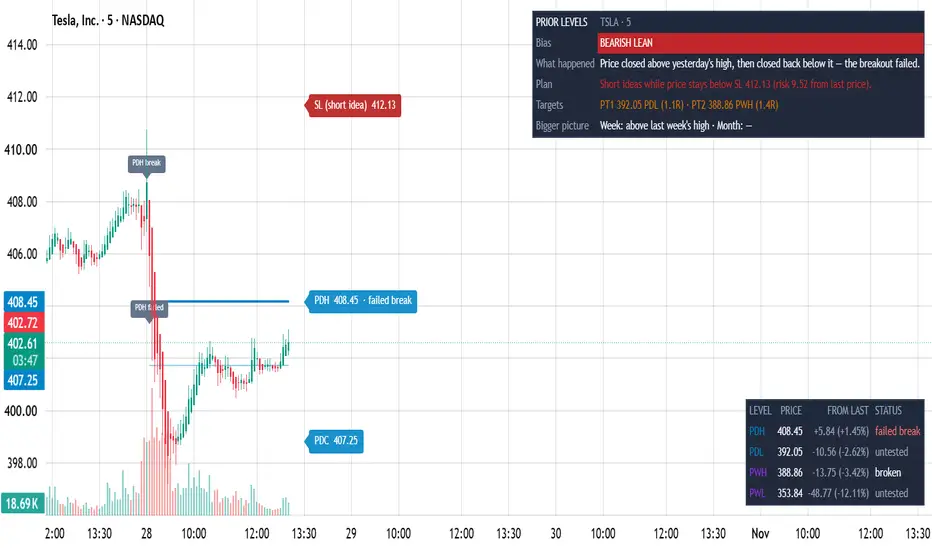
Plots the prior day, week and month high and low, plus the prior day close, and tracks what price has done at each level during the current period. On intraday charts it also gives a bias, a stop level (SL) and two profit targets (PT1, PT2) based on what price did at yesterday's high and low.
Levels
• PDH / PDL / PDC – prior day high, low, close
• PWH / PWL – prior week high, low
• PMoH / PMoL – prior month high, low
All values come from completed periods and do not repaint.
Where the levels come from ("Levels from")
• Auto (default)
– Stocks, ETFs and DRs on intraday charts: built from the chart's regular-market bars, so pre- and post-market prices are excluded. Outside regular hours, "prior day" is the session that just closed, so pre-market shows yesterday's levels. A new week starts on the first session after the weekday resets (e.g. Friday → Monday); months follow the calendar.
– Futures, forex, crypto and other symbols: the exchange's daily, weekly and monthly bars.
• Exchange daily bars – always use the exchange's daily, weekly and monthly bars.
• Custom session from chart bars – build the levels from a session you set (default 09:30–16:00 New York), e.g. regular-hours levels on ES or NQ.
Levels built from chart bars need that much history loaded: a full prior week for PWH/PWL and a full prior month for PMoH/PMoL.
Status of each level (closed candles only)
• untested – no candle has traded through the level this period
• swept – a candle traded through the level and closed back at or inside it (for a high: high above, close at or below)
• broken – a candle closed beyond the level
• failed break – after a break, a candle closed back at or inside the level
Each level can be swept once per period; a level can break again after a failed break. Status resets when a new period begins. Sweeps, breaks and failed breaks are marked on the candle where they happened.
Bias, SL and profit targets (intraday charts)
The bias comes from the most recent event at PDH or PDL today and resets each day:
• BULLISH – a candle closed above PDH and price is still above it. SL: 0.25 × daily ATR(14) below PDH.
• BEARISH – a candle closed below PDL and price is still below it. SL: 0.25 × daily ATR above PDL.
• BULLISH LEAN – PDL was swept or had a failed break, and price is back above PDL. SL: today's low minus 0.10 × daily ATR.
• BEARISH LEAN – PDH was swept or had a failed break, and price is back below PDH. SL: today's high plus 0.10 × daily ATR.
• NEUTRAL – none of the above; the panel shows the level above which the read turns bullish and the level below which it turns bearish.
"Today's" high and low run from the start of the current day; for stocks this includes pre-market.
PT1 and PT2 are the nearest two levels in the bias direction, chosen from: PDC, PDH, PDL, PWH, PWL, PMoH, PMoL, and PDH/PDL ± ½× and 1× the prior day's range. Targets closer than 0.10 × daily ATR to the last price are skipped, and PT2 must be at least that far beyond PT1. Each target shows R = distance from the last price to the target ÷ distance from the last price to the SL. All ATR multiples are inputs.
Panel and table
The bias panel shows the bias, what happened in one sentence, the plan (SL and risk from the last price), the targets with R, and where price sits versus last week's and last month's range. The level table lists each level's price, its distance from the last price in points and %, and its status. Right-edge labels show each level with its exact price and status, plus PT1, PT2 and SL tags, stacked so they never overlap. Line colors are set in the Style tab; label and panel colors in Inputs.
Alerts
• "Any alert() function call" – one alert for every sweep, break and failed break on all levels, with the level and price in the message.
• Single conditions: PDH swept, PDL swept, PDH broken, PDL broken, PDH/PDL failed break, prior week level swept/broken, prior month level swept/broken.
All alerts trigger on candle close.
Limits
• Prior day levels are hidden on daily and higher charts, weekly levels on weekly and higher, monthly levels on monthly. Bias and targets need an intraday chart.
• The bias, SL and targets describe what price has done at these levels. They are not predictions or trade recommendations, and a level can fail at any time.
Levels
• PDH / PDL / PDC – prior day high, low, close
• PWH / PWL – prior week high, low
• PMoH / PMoL – prior month high, low
All values come from completed periods and do not repaint.
Where the levels come from ("Levels from")
• Auto (default)
– Stocks, ETFs and DRs on intraday charts: built from the chart's regular-market bars, so pre- and post-market prices are excluded. Outside regular hours, "prior day" is the session that just closed, so pre-market shows yesterday's levels. A new week starts on the first session after the weekday resets (e.g. Friday → Monday); months follow the calendar.
– Futures, forex, crypto and other symbols: the exchange's daily, weekly and monthly bars.
• Exchange daily bars – always use the exchange's daily, weekly and monthly bars.
• Custom session from chart bars – build the levels from a session you set (default 09:30–16:00 New York), e.g. regular-hours levels on ES or NQ.
Levels built from chart bars need that much history loaded: a full prior week for PWH/PWL and a full prior month for PMoH/PMoL.
Status of each level (closed candles only)
• untested – no candle has traded through the level this period
• swept – a candle traded through the level and closed back at or inside it (for a high: high above, close at or below)
• broken – a candle closed beyond the level
• failed break – after a break, a candle closed back at or inside the level
Each level can be swept once per period; a level can break again after a failed break. Status resets when a new period begins. Sweeps, breaks and failed breaks are marked on the candle where they happened.
Bias, SL and profit targets (intraday charts)
The bias comes from the most recent event at PDH or PDL today and resets each day:
• BULLISH – a candle closed above PDH and price is still above it. SL: 0.25 × daily ATR(14) below PDH.
• BEARISH – a candle closed below PDL and price is still below it. SL: 0.25 × daily ATR above PDL.
• BULLISH LEAN – PDL was swept or had a failed break, and price is back above PDL. SL: today's low minus 0.10 × daily ATR.
• BEARISH LEAN – PDH was swept or had a failed break, and price is back below PDH. SL: today's high plus 0.10 × daily ATR.
• NEUTRAL – none of the above; the panel shows the level above which the read turns bullish and the level below which it turns bearish.
"Today's" high and low run from the start of the current day; for stocks this includes pre-market.
PT1 and PT2 are the nearest two levels in the bias direction, chosen from: PDC, PDH, PDL, PWH, PWL, PMoH, PMoL, and PDH/PDL ± ½× and 1× the prior day's range. Targets closer than 0.10 × daily ATR to the last price are skipped, and PT2 must be at least that far beyond PT1. Each target shows R = distance from the last price to the target ÷ distance from the last price to the SL. All ATR multiples are inputs.
Panel and table
The bias panel shows the bias, what happened in one sentence, the plan (SL and risk from the last price), the targets with R, and where price sits versus last week's and last month's range. The level table lists each level's price, its distance from the last price in points and %, and its status. Right-edge labels show each level with its exact price and status, plus PT1, PT2 and SL tags, stacked so they never overlap. Line colors are set in the Style tab; label and panel colors in Inputs.
Alerts
• "Any alert() function call" – one alert for every sweep, break and failed break on all levels, with the level and price in the message.
• Single conditions: PDH swept, PDL swept, PDH broken, PDL broken, PDH/PDL failed break, prior week level swept/broken, prior month level swept/broken.
All alerts trigger on candle close.
Limits
• Prior day levels are hidden on daily and higher charts, weekly levels on weekly and higher, monthly levels on monthly. Bias and targets need an intraday chart.
• The bias, SL and targets describe what price has done at these levels. They are not predictions or trade recommendations, and a level can fail at any time.

Feragatname
Bilgiler ve yayınlar, TradingView tarafından sağlanan veya onaylanan finansal, yatırım, alım satım veya diğer türden tavsiye veya öneriler anlamına gelmez ve teşkil etmez. Kullanım Koşulları bölümünde daha fazlasını okuyun.
Feragatname
Bilgiler ve yayınlar, TradingView tarafından sağlanan veya onaylanan finansal, yatırım, alım satım veya diğer türden tavsiye veya öneriler anlamına gelmez ve teşkil etmez. Kullanım Koşulları bölümünde daha fazlasını okuyun.