EV Footprint Response
EV Footprint Response
Read classified volume pressure. Wait for the price response.
EV Footprint Response studies situations where strong classified buying or selling pressure is accompanied by a contained candle body and rejection from an extreme. It first marks a candidate, then waits for a later closing confirmation. Its purpose is to make that sequence visible and auditable: effort, candidate, response or failure.
The indicator uses Pine Script v6's native footprint request and consecutive diagonal imbalance rows. It combines those rows with normalized delta, relative footprint volume, candle geometry and a finite confirmation window. It is an overlay with a compact panel, candidate zones, confirmation markers and selectable alert conditions.
1 · Reading the chart

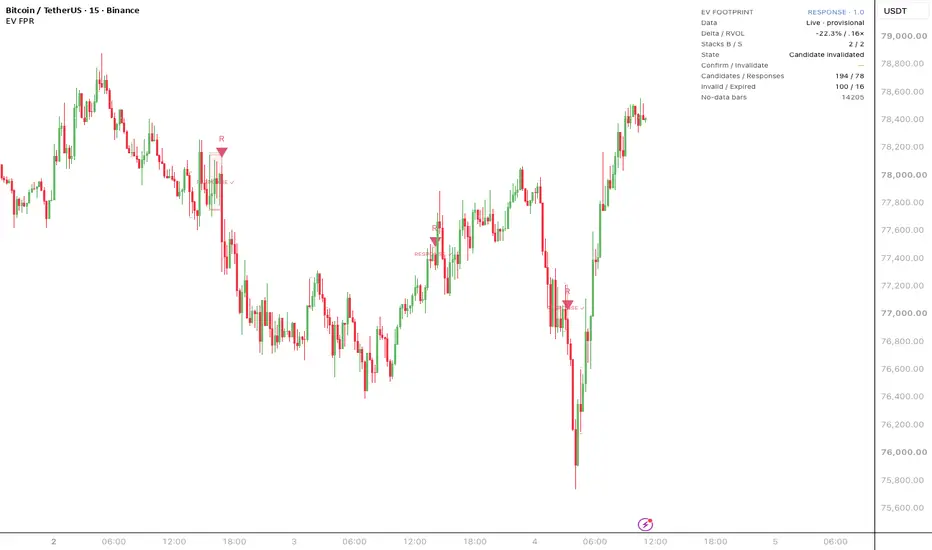
Amber identifies a pending candidate. Teal identifies a confirmed bullish response; rose identifies a confirmed bearish response. The R triangle is placed on the candle when the response becomes confirmed, not on the earlier candidate candle. Thin pending levels show the closing confirmation threshold and the invalidation boundary.
The screenshot illustrates the interface and historical conditions. The markers are not a list of executed trades or profitable outcomes.
2 · What creates a candidate?
A bullish candidate requires negative classified delta, a stack of selling imbalances, elevated relative footprint volume, a sufficiently large range relative to prior ATR, a contained body, and a close away from the low. A bearish candidate uses the inverse conditions: positive delta, buying imbalances and rejection from the high.
Default filters:
• Diagonal imbalance threshold: 300%.
• Consecutive imbalance rows: 2.
• Absolute delta: at least 15% of total footprint volume.
• Relative footprint volume: at least 1.2 times its prior 20-observation average.
• Body: no more than 50% of the candle range.
• Rejection: the close is at least 50% of the range away from the relevant extreme.
• Range: at least 0.25 times prior ATR.
Delta percentage is 100 × classified delta / total footprint volume. The relative-volume baseline excludes the current candle and uses prior available footprint observations; missing observations are skipped. Imbalance stacks require adjacent price rows. Candidates are created only on closed candles, and only one candidate can be pending at a time.
These conditions identify a possible effort-versus-result mismatch. They do not establish that an institution absorbed orders or that a reversal must follow.
3 · Confirmation, invalidation and expiry

For a bullish candidate, confirmation requires a later candle to close above the candidate high plus the confirmation buffer. For a bearish candidate, the close must be below the candidate low minus the buffer. The default buffer is 0.05 ATR; ATR is taken from the candle before the candidate and frozen for that candidate.
The default confirmation window is the next 5 candles, inclusive. A signal cannot confirm on its own candidate candle or after the window has elapsed. Equality with the threshold does not confirm.
A bullish candidate is invalidated if a later low breaches its low minus the invalidation buffer; a bearish candidate is invalidated if a later high breaches its high plus that buffer. The default invalidation buffer is also 0.05 frozen ATR. An exact touch does not invalidate. Invalidation takes precedence if a single candle both breaches that boundary and closes beyond the confirmation threshold. The model does not assume an unknown order of intrabar events.
After confirmation, invalidation or expiry, a configurable cooldown applies. New candidates do not replace a pending candidate. Confirmation is a completed pattern condition, not a profit target or trade-management rule. The close-up also shows that price can subsequently move against a confirmed response.
4 · Choose the footprint row size first
Ticks per row controls price resolution: row height equals the input multiplied by the symbol's minimum tick. It is not a number of currency units or index points.
For example, 100 ticks on a symbol with a 0.01 tick size creates a 1.00-unit price row. Four ticks on an instrument with a 0.25 tick size creates a 1.00-point row. These are arithmetic examples, not optimized presets.
If the candle contains fewer rows than the required stack, no stack can qualify. Smaller rows can reveal more detail and increase calculation load; larger rows aggregate more price levels. Adjust row size for the instrument and timeframe before comparing sensitivities. The supplied defaults are a starting point, not a universal configuration.
5 · Panel and display controls
The panel shows data availability, provisional live delta and relative volume, the longest buying/selling stacks, candidate state, pending levels and event counts. Panel position and colors are configurable. Each bar's footprint POC can be enabled as an optional reference; it is not a candidate filter.
The zone begins at the candidate candle and changes color when the candidate resolves. That historical box therefore shows the final state of an earlier candidate; it was not already confirmed at its origin. Use the R marker to locate the actual confirmation candle. Failed and expired boxes are hidden by default and can be retained with the display setting. The retained-zone limit bounds drawing history.
Candidate, response, invalidation and expiry counts describe events in the available chart history. They are not wins, losses, a win rate or a performance backtest.
6 · Alerts
Three alert conditions are available: new candidate, bullish response confirmed and bearish response confirmed. Candidate alerts are preliminary. Use closing-bar alerts and recreate alerts after changing inputs or updating the script, because existing TradingView alerts retain their creation-time configuration. The script does not create running alerts or place orders automatically.
7 · Data requirements and limitations
TradingView Premium or Ultimate is required for scripts requesting native footprint data. Availability and historical depth depend on the symbol, feed and timeframe. If footprint is missing, the script does not fabricate a substitute from OHLCV. Missing-data candles cannot create or confirm a candidate; price can still invalidate a pending candidate and elapsed bars still count toward expiry.
TradingView classifies footprint buying and selling volume from intrabar price action. This is not an exchange tape that directly identifies every trade's aggressor side. The indicator cannot establish hidden orders, institutional participation or actual absorption.
Candidate and confirmation decisions are made at candle close. Live panel metrics remain provisional. Feed corrections, intrabar coverage and differences between historical and realtime datasets can change calculations after a reload. Use standard candles and inspect the sequence in Bar Replay rather than assuming identical results across providers.
No profitability backtest, future-return probability or performance guarantee is provided. Use the tool as context alongside independent risk management.
Open-source implementation
Published under Mozilla Public License 2.0 so the calculations and state transitions can be inspected, tested and adapted. The model combines footprint information and price response; it does not claim that the underlying footprint or imbalance concepts are new.
Native footprint methodology: tradingview.com/pine-script-docs/concepts/other-timeframes-and-data/
Read classified volume pressure. Wait for the price response.
EV Footprint Response studies situations where strong classified buying or selling pressure is accompanied by a contained candle body and rejection from an extreme. It first marks a candidate, then waits for a later closing confirmation. Its purpose is to make that sequence visible and auditable: effort, candidate, response or failure.
The indicator uses Pine Script v6's native footprint request and consecutive diagonal imbalance rows. It combines those rows with normalized delta, relative footprint volume, candle geometry and a finite confirmation window. It is an overlay with a compact panel, candidate zones, confirmation markers and selectable alert conditions.
1 · Reading the chart
Amber identifies a pending candidate. Teal identifies a confirmed bullish response; rose identifies a confirmed bearish response. The R triangle is placed on the candle when the response becomes confirmed, not on the earlier candidate candle. Thin pending levels show the closing confirmation threshold and the invalidation boundary.
The screenshot illustrates the interface and historical conditions. The markers are not a list of executed trades or profitable outcomes.
2 · What creates a candidate?
A bullish candidate requires negative classified delta, a stack of selling imbalances, elevated relative footprint volume, a sufficiently large range relative to prior ATR, a contained body, and a close away from the low. A bearish candidate uses the inverse conditions: positive delta, buying imbalances and rejection from the high.
Default filters:
• Diagonal imbalance threshold: 300%.
• Consecutive imbalance rows: 2.
• Absolute delta: at least 15% of total footprint volume.
• Relative footprint volume: at least 1.2 times its prior 20-observation average.
• Body: no more than 50% of the candle range.
• Rejection: the close is at least 50% of the range away from the relevant extreme.
• Range: at least 0.25 times prior ATR.
Delta percentage is 100 × classified delta / total footprint volume. The relative-volume baseline excludes the current candle and uses prior available footprint observations; missing observations are skipped. Imbalance stacks require adjacent price rows. Candidates are created only on closed candles, and only one candidate can be pending at a time.
These conditions identify a possible effort-versus-result mismatch. They do not establish that an institution absorbed orders or that a reversal must follow.
3 · Confirmation, invalidation and expiry
For a bullish candidate, confirmation requires a later candle to close above the candidate high plus the confirmation buffer. For a bearish candidate, the close must be below the candidate low minus the buffer. The default buffer is 0.05 ATR; ATR is taken from the candle before the candidate and frozen for that candidate.
The default confirmation window is the next 5 candles, inclusive. A signal cannot confirm on its own candidate candle or after the window has elapsed. Equality with the threshold does not confirm.
A bullish candidate is invalidated if a later low breaches its low minus the invalidation buffer; a bearish candidate is invalidated if a later high breaches its high plus that buffer. The default invalidation buffer is also 0.05 frozen ATR. An exact touch does not invalidate. Invalidation takes precedence if a single candle both breaches that boundary and closes beyond the confirmation threshold. The model does not assume an unknown order of intrabar events.
After confirmation, invalidation or expiry, a configurable cooldown applies. New candidates do not replace a pending candidate. Confirmation is a completed pattern condition, not a profit target or trade-management rule. The close-up also shows that price can subsequently move against a confirmed response.
4 · Choose the footprint row size first
Ticks per row controls price resolution: row height equals the input multiplied by the symbol's minimum tick. It is not a number of currency units or index points.
For example, 100 ticks on a symbol with a 0.01 tick size creates a 1.00-unit price row. Four ticks on an instrument with a 0.25 tick size creates a 1.00-point row. These are arithmetic examples, not optimized presets.
If the candle contains fewer rows than the required stack, no stack can qualify. Smaller rows can reveal more detail and increase calculation load; larger rows aggregate more price levels. Adjust row size for the instrument and timeframe before comparing sensitivities. The supplied defaults are a starting point, not a universal configuration.
5 · Panel and display controls
The panel shows data availability, provisional live delta and relative volume, the longest buying/selling stacks, candidate state, pending levels and event counts. Panel position and colors are configurable. Each bar's footprint POC can be enabled as an optional reference; it is not a candidate filter.
The zone begins at the candidate candle and changes color when the candidate resolves. That historical box therefore shows the final state of an earlier candidate; it was not already confirmed at its origin. Use the R marker to locate the actual confirmation candle. Failed and expired boxes are hidden by default and can be retained with the display setting. The retained-zone limit bounds drawing history.
Candidate, response, invalidation and expiry counts describe events in the available chart history. They are not wins, losses, a win rate or a performance backtest.
6 · Alerts
Three alert conditions are available: new candidate, bullish response confirmed and bearish response confirmed. Candidate alerts are preliminary. Use closing-bar alerts and recreate alerts after changing inputs or updating the script, because existing TradingView alerts retain their creation-time configuration. The script does not create running alerts or place orders automatically.
7 · Data requirements and limitations
TradingView Premium or Ultimate is required for scripts requesting native footprint data. Availability and historical depth depend on the symbol, feed and timeframe. If footprint is missing, the script does not fabricate a substitute from OHLCV. Missing-data candles cannot create or confirm a candidate; price can still invalidate a pending candidate and elapsed bars still count toward expiry.
TradingView classifies footprint buying and selling volume from intrabar price action. This is not an exchange tape that directly identifies every trade's aggressor side. The indicator cannot establish hidden orders, institutional participation or actual absorption.
Candidate and confirmation decisions are made at candle close. Live panel metrics remain provisional. Feed corrections, intrabar coverage and differences between historical and realtime datasets can change calculations after a reload. Use standard candles and inspect the sequence in Bar Replay rather than assuming identical results across providers.
No profitability backtest, future-return probability or performance guarantee is provided. Use the tool as context alongside independent risk management.
Open-source implementation
Published under Mozilla Public License 2.0 so the calculations and state transitions can be inspected, tested and adapted. The model combines footprint information and price response; it does not claim that the underlying footprint or imbalance concepts are new.
Native footprint methodology: tradingview.com/pine-script-docs/concepts/other-timeframes-and-data/

Feragatname
Bilgiler ve yayınlar, TradingView tarafından sağlanan veya onaylanan finansal, yatırım, alım satım veya diğer türden tavsiye veya öneriler anlamına gelmez ve teşkil etmez. Kullanım Koşulları bölümünde daha fazlasını okuyun.
Feragatname
Bilgiler ve yayınlar, TradingView tarafından sağlanan veya onaylanan finansal, yatırım, alım satım veya diğer türden tavsiye veya öneriler anlamına gelmez ve teşkil etmez. Kullanım Koşulları bölümünde daha fazlasını okuyun.