Güncellendi
AG Pro Stop Hunt Map Engine [AGPro Series]
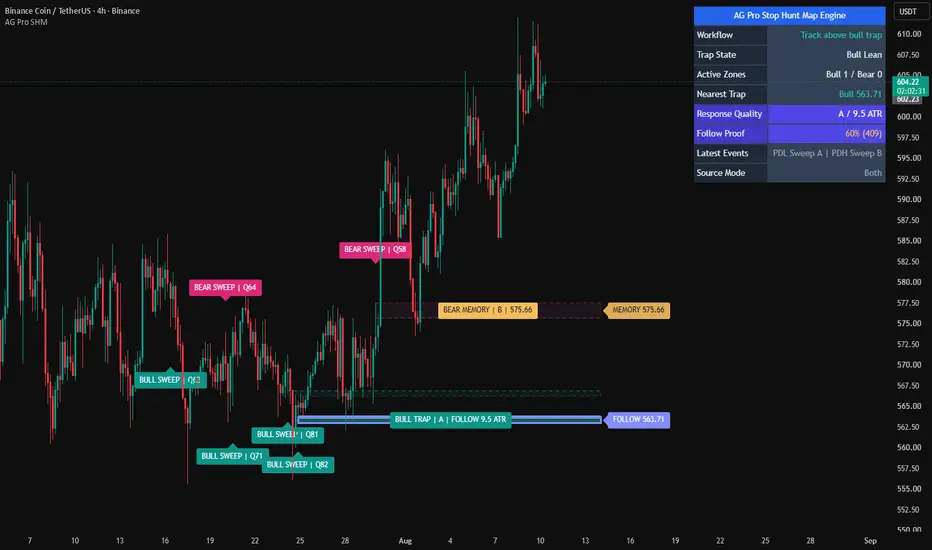
AG Pro Stop Hunt Map Engine [AGPro Series]
Overview / What it does
AG Pro Stop Hunt Map Engine is a price-action overlay designed to map potential trap zones after liquidity sweeps. The script focuses on moments where price briefly moves beyond an important reference level, rejects that move, and then closes back through the swept area. In practical terms, this helps traders visualize where a failed breakout or failed breakdown may have left trapped positioning behind.
The engine can work with pivot-based liquidity references, previous day high / previous day low references, or both at the same time. This makes it useful for traders who want a structured way to monitor classic stop-hunt behavior without relying on a single interpretation of liquidity. Instead of treating every wick beyond a level as meaningful, the script applies reclaim logic and filtering rules so that only sweeps with stronger reversal characteristics are highlighted.
The core goal is not to predict every reversal. The goal is to organize sweep events into a readable map: where the sweep happened, which side may be trapped, which zones remain active, and which levels are still relevant as price moves forward. That is why the script is built as a map engine rather than a simple marker tool.
This publication is especially suited to traders who study rejection structure, failed continuation, stop runs, and liquidity-driven reversals. It can be used as a visual context layer inside a broader workflow that may already include structure, trend, momentum, or higher-timeframe bias analysis.
Unique Edge
Many liquidity-sweep tools only mark a wick beyond a prior level and stop there. This script takes a more selective approach. It requires a reclaim condition, supports wick-to-body quality filtering, allows optional fake-sweep filtering, and maintains the resulting event as an actionable mapped zone rather than a one-bar marker.
Its main differentiation is the emphasis on post-sweep structure. Once a sweep qualifies, the script builds and extends a zone so the trader can continue monitoring that area after the original event. This provides a cleaner framework for seeing whether the market is respecting that trap region, moving away from it, or invalidating it.
Another important distinction is the visual hierarchy. The script is designed to separate nearest relevant zones from older or weaker context. This helps keep the chart readable while still preserving useful background information. Instead of cluttering the screen with every historical event at equal importance, the engine highlights what is currently closest and most relevant.
Methodology
The script first defines the liquidity source. Users can choose pivot highs and lows, previous day high and previous day low, or a combined mode that monitors both.
For a bullish trap scenario, price must sweep below a valid downside reference and then reclaim it according to the selected conditions. For a bearish trap scenario, price must sweep above a valid upside reference and then reclaim it. This creates two independent directional engines: one for bullish recovery after downside liquidity is taken, and one for bearish rejection after upside liquidity is taken.
The detection logic is built around several layers:
1. Sweep source selection
The engine checks whether price has moved beyond a chosen pivot or previous-day level.
2. Wick / body filter
The script can require a minimum wick-to-body relationship so that weak or low-conviction candles are filtered out.
3. Reclaim close requirement
The user can require price to close back through the swept level before the event is accepted.
4. Fake sweep filter
An optional penetration filter limits how deep price can move beyond the level before the event is treated as lower quality.
5. Zone persistence
Qualified sweep-and-reclaim events are not left as isolated markers. They are stored and extended forward as zones so the trader can monitor their ongoing relevance.
6. Nearest-zone emphasis
The display engine highlights the nearest bull and bear trap zones so current context is easier to read.
The result is a framework that treats sweep events as evolving market context rather than isolated historical dots.
Signals & Alerts
The script identifies two primary event types:
Bull Trap Reclaim
This appears when price sweeps below a valid reference level and then closes back above it, suggesting that downside liquidity may have been taken and rejected.
Bear Trap Reclaim
This appears when price sweeps above a valid reference level and then closes back below it, suggesting that upside liquidity may have been taken and rejected.
Visual elements can include:
- Sweep zones
- Trap labels
- Right-edge state tags
- Nearest-zone emphasis
- Origin markers on qualifying sweep bars
- A summary panel showing current state and nearest bull / bear trap information
Alert conditions are included for:
- Bullish trap reclaim events
- Bearish trap reclaim events
These alerts are event-based. They identify when a qualifying reclaim occurs according to the active settings.
Key Inputs
Sweep Source
Choose whether the engine uses pivots, previous day levels, or both.
Pivot Strength
Controls how strict the pivot reference detection should be.
Require Reclaim Close
Requires price to close back through the swept level before a zone is created.
Min Wick / Body Ratio
Filters low-quality sweeps by requiring stronger rejection candles.
Use Fake Sweep Filter
Enables an additional penetration-depth filter to reduce weaker events.
Max Penetration (ATR Multiple)
Sets the maximum allowed overshoot beyond the swept level when fake-sweep filtering is enabled.
Chart Mode
Allows a cleaner publish-style view or a more detailed analysis-style view.
Label Mode
Controls how aggressively labels are shown on the chart.
Highlight Nearest Bull / Bear Zones
Emphasizes the closest active zones for faster visual interpretation.
Summary Panel
Shows the current trap state, active bull and bear zone counts, nearest trap levels, and the last detected events.
Limitations & Transparency
This script is not a prediction engine and does not guarantee reversals. A sweep-and-reclaim event can still fail, especially in strong directional environments where price continues expanding after a temporary rejection.
Reference choice matters. Pivot-based detection and previous-day level detection describe different types of liquidity behavior. Depending on the instrument, timeframe, and volatility regime, one source may be more relevant than the other.
Filtering also changes behavior significantly. Tight wick/body requirements or stricter fake-sweep settings will reduce signal frequency. Looser settings will create more events but may also admit weaker structures.
Zones are contextual tools, not standalone trade instructions. Many traders may still want to combine the script with higher-timeframe structure, trend bias, volatility context, or execution rules before making decisions.
As with any chart overlay, visual cleanliness depends on timeframe, market conditions, and user configuration. Different settings may be appropriate for intraday charts versus higher-timeframe swing charts.
Risk Disclosure
This script is for chart analysis and market structure visualization only. It does not provide financial advice, trade recommendations, or guaranteed outcomes. Markets can remain irrational longer than a trap setup appears logical, and any liquidity sweep signal can fail.
Always apply independent judgment, position sizing discipline, and risk management. No single indicator should be used in isolation for live trading decisions.
Overview / What it does
AG Pro Stop Hunt Map Engine is a price-action overlay designed to map potential trap zones after liquidity sweeps. The script focuses on moments where price briefly moves beyond an important reference level, rejects that move, and then closes back through the swept area. In practical terms, this helps traders visualize where a failed breakout or failed breakdown may have left trapped positioning behind.
The engine can work with pivot-based liquidity references, previous day high / previous day low references, or both at the same time. This makes it useful for traders who want a structured way to monitor classic stop-hunt behavior without relying on a single interpretation of liquidity. Instead of treating every wick beyond a level as meaningful, the script applies reclaim logic and filtering rules so that only sweeps with stronger reversal characteristics are highlighted.
The core goal is not to predict every reversal. The goal is to organize sweep events into a readable map: where the sweep happened, which side may be trapped, which zones remain active, and which levels are still relevant as price moves forward. That is why the script is built as a map engine rather than a simple marker tool.
This publication is especially suited to traders who study rejection structure, failed continuation, stop runs, and liquidity-driven reversals. It can be used as a visual context layer inside a broader workflow that may already include structure, trend, momentum, or higher-timeframe bias analysis.
Unique Edge
Many liquidity-sweep tools only mark a wick beyond a prior level and stop there. This script takes a more selective approach. It requires a reclaim condition, supports wick-to-body quality filtering, allows optional fake-sweep filtering, and maintains the resulting event as an actionable mapped zone rather than a one-bar marker.
Its main differentiation is the emphasis on post-sweep structure. Once a sweep qualifies, the script builds and extends a zone so the trader can continue monitoring that area after the original event. This provides a cleaner framework for seeing whether the market is respecting that trap region, moving away from it, or invalidating it.
Another important distinction is the visual hierarchy. The script is designed to separate nearest relevant zones from older or weaker context. This helps keep the chart readable while still preserving useful background information. Instead of cluttering the screen with every historical event at equal importance, the engine highlights what is currently closest and most relevant.
Methodology
The script first defines the liquidity source. Users can choose pivot highs and lows, previous day high and previous day low, or a combined mode that monitors both.
For a bullish trap scenario, price must sweep below a valid downside reference and then reclaim it according to the selected conditions. For a bearish trap scenario, price must sweep above a valid upside reference and then reclaim it. This creates two independent directional engines: one for bullish recovery after downside liquidity is taken, and one for bearish rejection after upside liquidity is taken.
The detection logic is built around several layers:
1. Sweep source selection
The engine checks whether price has moved beyond a chosen pivot or previous-day level.
2. Wick / body filter
The script can require a minimum wick-to-body relationship so that weak or low-conviction candles are filtered out.
3. Reclaim close requirement
The user can require price to close back through the swept level before the event is accepted.
4. Fake sweep filter
An optional penetration filter limits how deep price can move beyond the level before the event is treated as lower quality.
5. Zone persistence
Qualified sweep-and-reclaim events are not left as isolated markers. They are stored and extended forward as zones so the trader can monitor their ongoing relevance.
6. Nearest-zone emphasis
The display engine highlights the nearest bull and bear trap zones so current context is easier to read.
The result is a framework that treats sweep events as evolving market context rather than isolated historical dots.
Signals & Alerts
The script identifies two primary event types:
Bull Trap Reclaim
This appears when price sweeps below a valid reference level and then closes back above it, suggesting that downside liquidity may have been taken and rejected.
Bear Trap Reclaim
This appears when price sweeps above a valid reference level and then closes back below it, suggesting that upside liquidity may have been taken and rejected.
Visual elements can include:
- Sweep zones
- Trap labels
- Right-edge state tags
- Nearest-zone emphasis
- Origin markers on qualifying sweep bars
- A summary panel showing current state and nearest bull / bear trap information
Alert conditions are included for:
- Bullish trap reclaim events
- Bearish trap reclaim events
These alerts are event-based. They identify when a qualifying reclaim occurs according to the active settings.
Key Inputs
Sweep Source
Choose whether the engine uses pivots, previous day levels, or both.
Pivot Strength
Controls how strict the pivot reference detection should be.
Require Reclaim Close
Requires price to close back through the swept level before a zone is created.
Min Wick / Body Ratio
Filters low-quality sweeps by requiring stronger rejection candles.
Use Fake Sweep Filter
Enables an additional penetration-depth filter to reduce weaker events.
Max Penetration (ATR Multiple)
Sets the maximum allowed overshoot beyond the swept level when fake-sweep filtering is enabled.
Chart Mode
Allows a cleaner publish-style view or a more detailed analysis-style view.
Label Mode
Controls how aggressively labels are shown on the chart.
Highlight Nearest Bull / Bear Zones
Emphasizes the closest active zones for faster visual interpretation.
Summary Panel
Shows the current trap state, active bull and bear zone counts, nearest trap levels, and the last detected events.
Limitations & Transparency
This script is not a prediction engine and does not guarantee reversals. A sweep-and-reclaim event can still fail, especially in strong directional environments where price continues expanding after a temporary rejection.
Reference choice matters. Pivot-based detection and previous-day level detection describe different types of liquidity behavior. Depending on the instrument, timeframe, and volatility regime, one source may be more relevant than the other.
Filtering also changes behavior significantly. Tight wick/body requirements or stricter fake-sweep settings will reduce signal frequency. Looser settings will create more events but may also admit weaker structures.
Zones are contextual tools, not standalone trade instructions. Many traders may still want to combine the script with higher-timeframe structure, trend bias, volatility context, or execution rules before making decisions.
As with any chart overlay, visual cleanliness depends on timeframe, market conditions, and user configuration. Different settings may be appropriate for intraday charts versus higher-timeframe swing charts.
Risk Disclosure
This script is for chart analysis and market structure visualization only. It does not provide financial advice, trade recommendations, or guaranteed outcomes. Markets can remain irrational longer than a trap setup appears logical, and any liquidity sweep signal can fail.
Always apply independent judgment, position sizing discipline, and risk management. No single indicator should be used in isolation for live trading decisions.
Sürüm Notları
Update Notes - V1.2This update focuses on presentation quality, publish readability, and chart hierarchy refinement while preserving the script’s core purpose: mapping stop-hunt style sweeps and reclaim behavior in a clean overlay format.
The main objective of this revision was not to turn the script into a different tool, but to improve how active bullish and bearish trap zones are displayed on the chart. In the previous presentation, the logic was already strong, but the visual hierarchy could still be made cleaner and more deliberate for public publication. This version pushes the display closer to a more polished, publication-ready structure.
What was improved in this update:
1) Stronger nearest-zone presentation
The nearest active bullish and bearish reclaim areas now read more clearly as primary chart objects. This helps the script communicate its main narrative faster on first glance, especially in static publish screenshots where visual clarity matters more than configuration depth.
2) Better visual hierarchy between active areas and context
The most relevant active zones are now emphasized more cleanly, while less important context remains visually secondary. This improves focus and reduces unnecessary competition between chart elements.
3) More refined reclaim-band appearance
The horizontal reclaim structures now present a stronger map-like identity on the chart. Instead of feeling like isolated lines, they behave more like deliberate reaction areas with clearer visual weight and better continuity toward the right edge of the chart.
4) Cleaner right-edge state signaling
The state tags were refined so active areas communicate their current status in a more compact and visually consistent way. This improves readability without adding extra noise.
5) Improved label balance for publication use
Trap labels remain visible and informative, but the overall label composition is now more controlled. The result is a cleaner chart with less crowding around the main event zone while keeping the essential information readable.
6) Better chart cleanliness in publish-oriented layouts
This revision improves the “show one main story” effect on the chart. The script now presents its active setup in a way that is easier to understand quickly, which is especially important for public script pages and example screenshots.
7) Panel presentation aligned more closely with the AG Pro visual standard
The summary panel remains compact and chart-friendly, with a cleaner headline treatment and stronger consistency with the broader AG Pro publication style. The panel is still informative, but it stays in a supporting role rather than competing with the price action.
8) More balanced chart composition
The relationship between the upper bearish reclaim area, lower bullish reclaim area, labels, and right-edge tags now feels more structured. This creates a more professional overall layout and a better balance between information density and empty space.
9) Readability upgrades without changing the analytical intent
This update does not reposition the script as a prediction engine or a strategy system. It remains an analytical visualization tool designed to highlight sweep-and-reclaim behavior around selected reference levels.
Why this update matters:
The underlying concept behind this script is already highly intuitive: price moves through a reference area, liquidity is taken, and the reclaim behavior is then mapped visually. Because the concept is easy to understand, presentation quality becomes especially important. A strong visual structure helps users interpret the chart faster and makes the script more effective in both live use and public presentation.
This version therefore focuses on readability, structure, and chart aesthetics rather than unnecessary feature inflation. The goal was to make the script look more deliberate, more premium, and more coherent without compromising clarity.
Transparency:
This script is an analytical overlay. It does not guarantee outcomes, does not predict future price with certainty, and should not be treated as an automated trading system. Trap zones and reclaim behavior are contextual chart elements that should be interpreted together with market structure, liquidity conditions, and user discretion.
As always, this update is centered on cleaner visualization, better chart communication, and a more disciplined presentation standard for public release.
Sürüm Notları
Update Notes - V1.3This update keeps Stop Hunt Map Engine in its original lane: a post-sweep trap-zone map built around failed breakout, failed breakdown, wick rejection, and reclaim behavior. The goal was not to turn it into another generic liquidity detector. The update strengthens the part that makes this script distinct: what happens after a qualified stop-hunt event creates a reclaim pocket.
What changed:
1. Trap Response Engine
The script now grades qualified trap zones using wick quality, reclaim close location, penetration depth, and source type. This helps suppress weaker trap events before they become visual objects and keeps the chart more selective by default.
2. Post-sweep follow-through tracking
Active zones now track how far price has responded from the reclaim level in ATR terms. This gives the map a stronger lifecycle read: fresh trap, active trap, follow-through zone, or aging structure.
3. Stronger hero-zone presentation
The nearest active bull and bear trap zones now receive clearer visual priority. When a zone produces meaningful follow-through, its reclaim rail and border receive a stronger accent treatment so the main chart story is easier to see at a glance.
4. Cleaner right-edge lifecycle tags
Right-edge tags can now show compact grade and lifecycle information for the nearest active zones. This keeps the visual language sharp without adding extra labels across the whole chart.
5. More useful summary panel
The panel now includes nearest bull and bear response data, showing both grade and ATR follow-through. The first panel row remains a single merged blue header row with only the script name, aligned with the AGPro Series public layout standard.
6. Better publication defaults
Panel font size now defaults to Normal. Label density remains restrained, offsets are preserved, and Publish mode focuses attention on the nearest active trap zones plus limited historical context.
6.1 Higher-timeframe memory visibility
Hourly and four-hour charts can occasionally have no active trap zone even though recent qualified traps were detected and later invalidated. V1.3 now keeps the most recent inactive trap memory visible for longer by default and extends that ghost context to the current bar as a faded band. This keeps public screenshots from looking empty while still separating memory zones from active zones.
7. Cleaner public identity
The public indicator title now follows the updated AGPro Series naming standard: the leading AG Pro prefix was removed from the TradingView title while the panel title keeps AG Pro.
Why this update matters:
Stop hunts often attract attention at the event candle, but the real chart value is usually in the aftermath. V1.3 makes that aftermath more readable by turning each qualified reclaim pocket into a lifecycle object with quality, response, freshness, and invalidation behavior. The script still does not try to be a broad sweep scanner, a liquidity heatmap, a session liquidity tool, or a footprint model. It remains a focused stop-hunt map engine with a cleaner premium presentation.
Sürüm Notları
UPDATE NOTES - VERSION 1.4This update adds a plain-language Next Action read at the top of the panel, a
confirmation-anchored Follow Rate statistic, and adaptive label text for cleaner contrast.
The core purpose of the script remains unchanged. Sweep detection, the trap-score engine,
the zone lifecycle, the response measurement, and the chart map all behave exactly as
before. This release improves how the read is presented and adds a measured follow-through
statistic.
This script continues to function as an analytical and visualization tool. It does not
attempt to predict price direction or provide guaranteed outcomes.
------------------------
What Changed
------------------------
• Next Action read at the top of the panel
A merged decision row now sits directly under the header and turns the current trap map
into a plain-language read, such as watching longs holding a fresh bullish reclaim,
watching shorts capping a fresh bearish reclaim, favouring the side with the dominant
active lean, or standing aside when there is no dominant trap. It describes the current
context, not a trade instruction.
• Follow Rate statistic (confirmation-anchored)
A new statistic measures, across trap zones that have completed their life, how often a
zone reached the strong-response threshold before it was invalidated or expired. It is
shown with a sample count so the reading can be judged in context.
• Adaptive label text colour
Trap labels and right-edge tags now adapt their text colour to the label background using
a luminance check, so neutral memory tags read with cleaner contrast instead of fixed
white text.
• Panel reorganised around the read
The panel now leads with the Next Action read, followed by the trap state, source, active
and nearest zone rows, the response rows, the Follow Rate, and the latest events.
------------------------
Visual Improvements
------------------------
• Improved label readability through adaptive text colour on labels and tags.
• Refined the panel hierarchy so the decision read is the first thing seen.
• Kept the trap zones, reclaim rails, origin markers, and ghost context intact.
• Preserved the publish-mode layout and zone styling.
------------------------
Interface & Usability
------------------------
• Optimised the panel layout for a clearer flow from read to detail.
• The Next Action read and Follow Rate update as zones form and resolve.
• Adjusted default presentation for a more balanced, premium appearance.
• Enhanced overall user experience without changing the core logic.
------------------------
Behavior Notes
------------------------
This update does not change the core analytical logic of the script. Sweep detection, the
trap-score engine, the zone lifecycle, and the response measurement are identical to the
previous version.
The Next Action read is a description of the current context, and the Follow Rate is a
historical measurement on completed zones. Neither is a prediction or a trade instruction.
Users should interpret outputs the same way as before, with added context.
------------------------
Limitations Reminder
------------------------
The script remains a rule-based analytical tool.
Volatility, liquidity, and timeframe differences may affect how zones, labels, and the
Follow Rate appear. The Follow Rate reflects only past completed zones and should be read
with its sample count in mind.
Outputs should always be interpreted within broader market context.
------------------------
Risk Reminder
------------------------
This script is for educational and analytical purposes only.
It does not provide financial advice or guaranteed trading outcomes.
Users remain responsible for their own decisions.
Sürüm Notları
Version 1.5 – Bounded Trap WorkflowThis release preserves the established stop-hunt detection, grading, response proof, and alert model while rebuilding the public-chart hierarchy around bounded planning zones, clearer event memory, and a compact decision panel.
• Replaced indefinite right extensions with a configurable 22-bar forward projection for active trap zones and reclaim rails.
• Converted active and memory identifiers into filled, contrast-safe badges centered inside their zones; edge badges now carry lifecycle and price context.
• Unified historical event, centered zone, and right-edge badge sizing under the single Label Font Size control for consistent chart typography.
• Added a capped historical sweep-badge stream using qualified event direction and score, improving chart density without uncontrolled label accumulation.
• Rebuilt the panel as one merged blue title row plus eight compact workflow rows; the former full-width action sentence is now a standard Workflow value.
• Preserved pivot and PDH/PDL detection, trap scoring, merge rules, lifecycle invalidation, follow-proof accounting, and both alert conditions.

Feragatname
Bilgiler ve yayınlar, TradingView tarafından sağlanan veya onaylanan finansal, yatırım, alım satım veya diğer türden tavsiye veya öneriler anlamına gelmez ve teşkil etmez. Kullanım Koşulları bölümünde daha fazlasını okuyun.
Feragatname
Bilgiler ve yayınlar, TradingView tarafından sağlanan veya onaylanan finansal, yatırım, alım satım veya diğer türden tavsiye veya öneriler anlamına gelmez ve teşkil etmez. Kullanım Koşulları bölümünde daha fazlasını okuyun.