Güncellendi
Smart Buy Sell Indicator V1
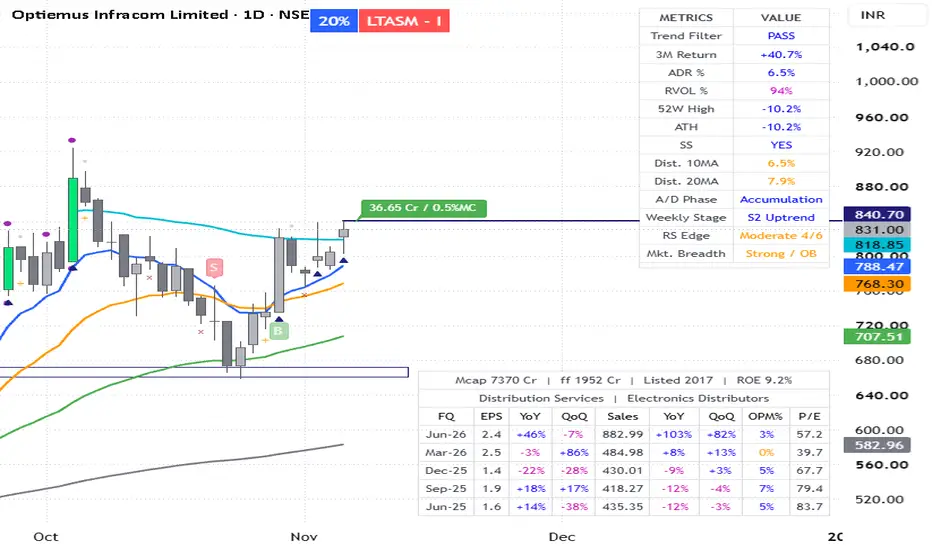
This indicator is designed to identify **potential trend reversals and momentum-based trading opportunities** using a combination of **two EMAs and RSI**.
#### 📊 Indicators Used
Fast EMA (Default: 9 EMA): Tracks short-term price movement.
Slow EMA (Default: 21 EMA): Identifies the broader short-term trend.
RSI (Default: 14): Confirms the strength and momentum of the move.
### 🟢 BUY Signal
A BUY signal is generated when:
The 9 EMA crosses above the 21 EMA, indicating a possible upward trend reversal.
RSI is 50 or above, confirming positive momentum.
How to use: Consider the BUY signal as an indication of bullish momentum. It can be used for a fresh entry or to identify a possible continuation of an upward move.
### 🔴 SELL Signal
A SELL signal is generated when:
The 9 EMA crosses below the 21 EMA, indicating a possible downward trend reversal.
RSI is 50 or below, confirming negative momentum.
How to use: Consider the SELL signal as an indication of weakening momentum or a potential bearish trend. It can be used to exit a long position or, depending on your trading strategy, identify a potential short-selling opportunity.
### ⚠️ Important Usage Tips
* Best used on **liquid stocks and indices.
* The indicator works better when the market is trending.
* Avoid relying solely on signals during **sideways or highly volatile markets**, where EMA crossovers may generate false signals.
* Always consider **support/resistance, price action, volume and the overall market trend** before taking a trade.
* Use an appropriate **stop-loss**, preferably based on the recent swing low for BUY trades and recent swing high for SELL trades.
### In Simple Terms
>EMA crossover identifies the change in trend, while RSI confirms whether momentum supports that direction.
This makes the indicator useful for traders looking for simple, rule-based BUY and SELL signals rather than relying on EMA crossovers alone.
#### 📊 Indicators Used
Fast EMA (Default: 9 EMA): Tracks short-term price movement.
Slow EMA (Default: 21 EMA): Identifies the broader short-term trend.
RSI (Default: 14): Confirms the strength and momentum of the move.
### 🟢 BUY Signal
A BUY signal is generated when:
The 9 EMA crosses above the 21 EMA, indicating a possible upward trend reversal.
RSI is 50 or above, confirming positive momentum.
How to use: Consider the BUY signal as an indication of bullish momentum. It can be used for a fresh entry or to identify a possible continuation of an upward move.
### 🔴 SELL Signal
A SELL signal is generated when:
The 9 EMA crosses below the 21 EMA, indicating a possible downward trend reversal.
RSI is 50 or below, confirming negative momentum.
How to use: Consider the SELL signal as an indication of weakening momentum or a potential bearish trend. It can be used to exit a long position or, depending on your trading strategy, identify a potential short-selling opportunity.
### ⚠️ Important Usage Tips
* Best used on **liquid stocks and indices.
* The indicator works better when the market is trending.
* Avoid relying solely on signals during **sideways or highly volatile markets**, where EMA crossovers may generate false signals.
* Always consider **support/resistance, price action, volume and the overall market trend** before taking a trade.
* Use an appropriate **stop-loss**, preferably based on the recent swing low for BUY trades and recent swing high for SELL trades.
### In Simple Terms
>EMA crossover identifies the change in trend, while RSI confirms whether momentum supports that direction.
This makes the indicator useful for traders looking for simple, rule-based BUY and SELL signals rather than relying on EMA crossovers alone.
Sürüm Notları
### Briefing about the Add-onsThe updated **Smart Buy Sell Indicator V1** now includes the following additional features:
#### 1. EMA / SMA Selection
You can select either:
EMA – Exponential Moving Average
SMA – Simple Moving Average
The selected type is applied to the **Fast MA, Slow MA, 50 MA and 200 MA.
---
#### 2. 50 MA – Trend Reference
The indicator now includes a 50-period Moving Average.
* Can be individually turned ON/OFF
* Helps identify the medium-term trend
* Price above 50 MA generally indicates stronger medium-term momentum
* Price below 50 MA may indicate weakness
---
#### 3. 200 MA – Long-Term Trend Reference
A 200-period Moving Average has also been added.
* Can be individually turned ON/OFF
* Helps identify the broader long-term trend
* Price above 200 MA generally indicates a stronger long-term structure
* Price below 200 MA can indicate a weaker long-term structure
Note:The 50 MA and 200 MA are only for trend analysis and **do not affect BUY or SELL signals.
---
### 4. 52-Week High %
The dashboard shows how far the current price is from its 52-week high.
Example:
-11.8%
This means the current price is approximately 11.8% below its 52-week high.
0% means the stock is currently at its 52-week high.
This is useful for identifying stocks trading close to their recent highs.
---
### 5. ATH % (All-Time High)
The dashboard also shows the percentage distance from the stock's All-Time High.
Example:
-20%
This means the current price is 20% below its recorded ATH.
0% means the stock is trading at its ATH.
This helps identify how close a stock is to its historical peak.
---
### 6. ADR % – Average Daily Range
ADR % measures the stock's average daily price movement.
Higher ADR generally indicates:
* Higher volatility
* Larger potential daily moves
Lower ADR generally indicates:
* Lower volatility
* Smaller daily price movement
---
### 7. RVOL % – Relative Volume
RVOL compares the current volume with its average volume.
Example:
RVOL 200% means the current volume is approximately twice the average volume
Higher RVOL can help confirm:
* Breakouts
* Strong momentum
* Institutional participation
---
### 8. Avg TO. – Average Turnover
Avg TO. represents the average traded value of the stock, displayed in Crores.
Example:
₹66.8 Cr
Higher average turnover generally indicates better liquidity and greater market participation.
---
### Overall Usage
The indicator can now be used as a combination of:
Entry/Exit Signals + Trend Analysis + Volume Confirmation + Liquidity Analysis + High Proximity Analysis
The Fast/Slow MA crossover with RSI confirmation remains responsible for generating BUY and SELL signals, while the 50/200 MA and dashboard metrics provide additional confirmation and context.
Sürüm Notları
### 🟣 Purple Dot — BriefA purple dot below the candle indicates that the stock is showing strong upward momentum along with high trading volume.
The dot appears only when both conditions are met simultaneously:
Volume is 5,00,000 or more (customizable), and
Price has risen by 5% or more compared with the previous candle's close (customizable).
### How to use it
The purple dot is a momentum alert, not an independent BUY signal. It can be useful for spotting:
* Strong momentum stocks
* High-volume breakouts
* Potential swing opportunities
* Stocks worth monitoring for follow-through
It becomes a stronger confirmation when combined with your BUY signal, 50 MA/200 MA trend, and a breakout near important levels such as the 52-week high or ATH.
Sürüm Notları
Bug fixedSürüm Notları
Bug fixedSürüm Notları
## New Add-ons### 🟠 NR7 `ˣ`
* Smallest candle range among the last 7 candles.
* Shows a tiny orange **`ˣ` below the candle.
* Indicates strong volatility contraction** and a possible upcoming breakout.
### 🟠 NR5 `⁺`
* Smallest candle range among the last 5 candles.
* Shows a tiny orange `⁺` below the candle.
* Indicates volatility contraction, but NR7 is generally stronger.
### 📊 Dashboard Size
You can now select:
Tiny | Small | Normal
This changes the dashboard text size according to your preference.
### Quick Use
NR7/NR5 → Wait for breakout → Confirm with trend and volume.
`ˣ` = NR7 (stronger)
`⁺` = NR5 (more frequent)
Sürüm Notları
Updated the Strong start componentSürüm Notları
Minor bug fixedSürüm Notları
Minor bug fixedSürüm Notları
## SVRO — Updated ConceptSVRO is a trading setup concept credited to Manas Arora, customized and automated in the indicator.
SVRO combines four confirmations:
### S — Strong Start
The stock should show strength in the early part of the trading session.
### V — Value Area High
Price should be trading above the Previous Day's Value Area High (VAH), indicating strength above an important volume-profile level.
### R — Relative Volume
The stock should show the required volume participation compared with its normal average volume.
### O — Opening Range Breakout
Price should break above the Opening Range.
---
## SVRO BUY Trigger
A BUY signal is generated only when all four conditions are satisfied:
Strong Start
+
Above Previous Day VAH
+
Relative Volume Confirmation
+
Opening Range Breakout
↓
SVRO BUY
## Updated Timeframe Feature
You can now select the SVRO Signal Timeframe:
### 🟢 5-Minute SVRO
All SVRO conditions are evaluated using the 5-minute setup.
SVRO Timeframe = 5 Minutes
Opening Range = First 5 Minutes
This provides an earlier and faster BUY trigger.
### 🟢 15-Minute SVRO
All SVRO conditions are evaluated using the 15-minute setup.
SVRO Timeframe = 15 Minutes
Opening Range = First 15 Minutes
This provides a slower and more conservative confirmation.
## Important: 5M and 15M Signals Are Independent
A 5-minute SVRO BUY does not automatically mean a 15-minute SVRO BUY will trigger.
Each timeframe evaluates the setup independently.
5M SVRO BUY ≠ Automatic 15M SVRO BUY
For example:
5M SVRO → BUY 🟢
15M SVRO → NO 🔴
is possible.
---
## Dashboard Behaviour
When the selected SVRO timeframe generates a valid BUY:
* On the selected intraday timeframe → SVRO = BUY
* On the Daily chart → SVRO = BUY 5M or BUY 15M, depending on the selected SVRO timeframe.
The standalone SS row has been removed from the dashboard, since Strong Start is already included as the S condition inside SVRO.
Sürüm Notları
### Brief about the current add-ons* Trend Filter – Checks whether the stock meets the selected trend criteria.
* Prior Uptrend – Shows whether the stock had a meaningful uptrend before the current setup.
* ADR % – Displays the stock's Average Daily Range percentage.
* RVOL % – Shows current volume strength compared with its average volume.
* 52W High – Indicates how close the stock is to its 52-week high.
* ATH – Indicates the stock's position relative to its All-Time High.
* Avg TO. – Shows average turnover/liquidity.
* PP – Indicates whether the price meets the Pocket Pivot condition.
* SS (Strong Start)** – Now requires:
* Positive opening above the previous close
* Low holding above 99.5% of the previous close
* First 5-minute volume ≥ the selected threshold (default 10% of average daily volume)
* Price crosses the **previous day's high
* Mkt. Breadth – Shows the breadth condition of the user-selected market index.
ORB and SVRO have been completely removed.
Sürüm Notları
Minor correction done to SS. working fine nowSürüm Notları
Upgraded the Market breadth logicSürüm Notları
Added Vwap as an optional indicator for intraday trading.Sürüm Notları
Improved Market breadth feature
Feragatname
Bilgiler ve yayınlar, TradingView tarafından sağlanan veya onaylanan finansal, yatırım, alım satım veya diğer türden tavsiye veya öneriler anlamına gelmez ve teşkil etmez. Kullanım Koşulları bölümünde daha fazlasını okuyun.
Feragatname
Bilgiler ve yayınlar, TradingView tarafından sağlanan veya onaylanan finansal, yatırım, alım satım veya diğer türden tavsiye veya öneriler anlamına gelmez ve teşkil etmez. Kullanım Koşulları bölümünde daha fazlasını okuyun.